Most Asian restaurant owners already know their labor costs are too high and their systems don't talk to each other. What's harder to see is exactly where the money leaks out — a manager re-entering the same order into three different screens, a server walking food orders across the room because the kitchen display doesn't sync with the online ordering app, a new hire quitting in week two because nobody had time to train them properly. This white paper breaks down three connected problems that quietly drain profit at Asian restaurants across the U.S. — labor shortage and cost, slow table turnover and order flow, and the hidden expense of running four or five disconnected systems — and lays out what actually fixes each one. This white paper shows which specific changes free up staff hours, seat more guests per shift, and put money back into the business, without asking any owner to buy a bigger tech stack than they need.
Every statistic in the pages that follow carries a named source and a link: the National Restaurant Association's 2026 industry outlook, monthly turnover data from the U.S. Bureau of Labor Statistics, restaurant payroll-cost and table-turnover benchmarks compiled by Toast from National Restaurant Association survey data, and Chowbus's own disclosed operating figures. Where a number in this paper doesn't have a name and a link attached to it, it isn't included, because most of what circulates about restaurant technology returns is marketing math dressed up as research, and a restaurant owner deciding where to spend the next dollar deserves better than that.
Chapter 1 traces where labor hours actually go at a typical Asian restaurant and what the national labor data says about why the shortage isn't likely to ease on its own. Chapter 2 follows a guest from the door to the table to the check, and identifies the specific points where that path stalls at hot pot, all-you-can-eat, bubble tea, and full-service concepts. Chapter 3 puts a number on what running four or five disconnected systems actually costs over a year, and works through the arithmetic of what replacing them returns. The conclusion turns all three chapters into a week-by-week, ninety-day plan built to run alongside a restaurant's normal service, not instead of it.
Walk into a busy hot pot restaurant on a Friday night and you'll usually find one of two things happening in the back office: a manager frantically toggling between a POS terminal, a tablet running a third-party delivery app, and a laptop with the online ordering dashboard open — or a business that figured out years ago how to run all three from one screen. The gap between those two restaurants isn't effort. It's tooling.
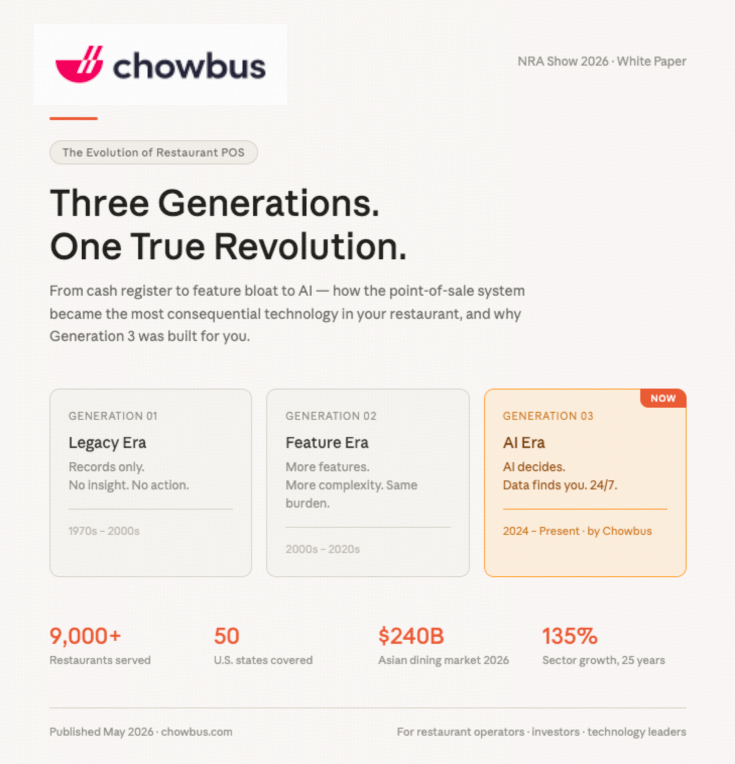
The Asian restaurant sector — Chinese, Japanese, Korean, Vietnamese, Thai, and bubble tea concepts across North America — is one of the fastest-growing corners of American dining. By Chowbus's own market analysis, the sector is on pace to reach $240 billion by the end of 2026, after growing 135% over the past 25 years, a rate of expansion that has outrun much of the broader restaurant industry. But growth on the top line hasn't been matched by growth in the tools underneath it. A large share of these businesses are still owner-operated, immigrant-founded, and running on software that was never built with a bilingual staff, a lazy-susan seating layout, or an all-you-can-eat pricing model in mind.
That mismatch shows up as three specific, measurable problems: too much labor spent on tasks a system could handle, too much time between when a guest sits down and when the table turns over again, and too much money paid — in subscriptions, in commissions, in duplicated data entry — to keep four or five separate systems limping along together.
This paper is written for the owner-operator running one to ten locations, not a franchise headquarters managing hundreds of units through a corporate operations team. The math, the scenarios, and the ninety-day plan in the conclusion all assume a business where the owner or a small management team is directly involved in scheduling, purchasing, and day-to-day decisions, because that's how most Asian restaurants in this sector are actually run, and generic enterprise-scale advice tends to assume resources and layers of management this audience doesn't have.
It's also written with the specific formats common in this sector in mind — hot pot, Korean BBQ, all-you-can-eat, bubble tea, and full-service Chinese, Japanese, Vietnamese, and Thai restaurants — rather than treating "restaurant" as one interchangeable category. Where the data allows it, this paper draws a distinction between what applies broadly across the restaurant industry and what's specific to these formats, so an owner can tell which parts of the analysis apply directly to their own business and which are general industry context.
Zoom out from any single restaurant and the national numbers explain why these three problems are so persistent right now, rather than a permanent fact of the business. According to the National Restaurant Association's 2026 industry outlook, total U.S. restaurant and foodservice sales are projected to reach $1.55 trillion this year, but real, inflation-adjusted growth sits at just 1.3%. Most of the top-line increase an owner sees on paper is price passed through to the guest, not more people walking in the door.
The cost side of that equation is broad, not concentrated in one line item. The same NRA outlook reports that more than 9 in 10 operators cite food, labor, insurance, energy, and swipe fees as significant cost challenges heading into the year. Against that backdrop, 42% of operators said their restaurant was not profitable, and 60% reported softer customer traffic in 2025 than the year before. Demand didn't collapse; it cooled at the exact moment costs kept climbing, and that combination is what turns a restaurant from comfortably profitable into break-even or worse.
Labor is telling a related but distinct story. Operators are forecast to add more than 100,000 jobs in 2026, pushing total restaurant and foodservice employment to a projected 15.8 million — an industry still expanding its headcount even as nearly three-quarters of operators say they plan to hire but expect real difficulty finding experienced managers and chefs. Growth and scarcity are showing up in the same labor market at the same time, which is precisely the environment where a restaurant that runs more efficiently pulls ahead of one that doesn't.
There's a demand-side detail that matters just as much: more than 7 in 10 consumers told the NRA they would eat out more often if they had more disposable income. The appetite is there. What's constraining it is the same cost pressure squeezing operators from the other side of the counter, which means a restaurant able to hold pricing steady by controlling its own costs — rather than passing every increase straight to the check — has a real edge in a market where price sensitivity is rising for everyone.
This is a national picture, not an Asian-restaurant-specific one. But it explains why the labor, turnover, and technology-overhead problems in the next three chapters aren't a niche concern. They're the same pressures every restaurant operator is navigating right now, showing up in a sharper form at restaurants running formats, languages, and staffing models that most of the software on the market was never designed around.
Restaurant technology marketing is full of numbers with no source attached — "cut labor costs by 30%," "increase revenue by 20%" — that sound precise and mean nothing, because nobody can trace them back to a study, a survey, or even a specific restaurant. This paper takes the opposite approach. Every statistic that isn't Chowbus's own disclosed data is linked to the report that produced it, on the first use in each chapter, so a reader can check the number rather than take it on faith. Two figures in this introduction and the conclusion — the $240 billion market size and the 135% growth rate — are Chowbus's own market analysis rather than an independently published research figure, and they're labeled that way rather than dressed up as something they're not. That distinction should matter to any owner deciding where to spend the next dollar.
It helps to be specific about what "integrated" actually means before diving into three chapters that use the word often. It doesn't mean a single vendor selling every possible add-on under one brand name while those add-ons still operate as separate databases behind the scenes — that's consolidation of billing, not of data, and it doesn't remove any of the manual reconciliation work described in Chapter 3.
A genuinely integrated system means an order placed at a table, through a kiosk, or through the restaurant's own online ordering channel all lands in the same kitchen queue, gets attributed to the same customer record if that guest has ordered before, and shows up in the same sales report at the end of the night without anyone exporting a file from one dashboard and importing it into another. The menu lives in one place, so a price change or an 86'd item updates everywhere at once instead of requiring four separate edits. The language setting is a property of the user, not a separate version of the software, so a bilingual staff can each work in the language they're most comfortable in, in the same room, on the same orders, at the same time.
That distinction matters because a restaurant can spend real money "upgrading" technology and still carry every inefficiency described in this white paper, if what it bought was a better-looking version of the same disconnected setup rather than an actually unified one. The chapters that follow are specific about the difference, because it's the difference between a fix that works and a fix that just moves the same problems onto newer hardware.
This white paper works through each of those three problems in order, with the specific mechanics of why they happen at Asian restaurants in particular, and what changes actually move the needle. Chapter 1 looks at labor: where the hours really go, and which changes free them up. Chapter 2 looks at the path from a guest walking in to a table turning over, and where that path gets stuck. Chapter 3 looks at what it costs — in dollars, not just in frustration — to run disconnected systems, and what an integrated platform actually returns. The last section turns all three into a 90-day plan an owner-operator can actually execute without shutting down to do it.
Start with the cost that's easiest to feel and hardest to fix with a quick hack: labor.
Ask a restaurant owner what their biggest operational headache is, and "finding and keeping staff" comes up almost every time — but the conversation usually stops at hiring. The deeper problem is what happens after someone's hired: how much of their time goes to work a system should be doing instead, and how long it takes before they're actually productive.
A general POS system built for a generic American diner assumes a fairly narrow hiring pool: native English speakers, familiar with a standard per-item ordering flow, working a job they've probably done before. That assumption breaks down fast at a hot pot restaurant staffing a weekend rush, a Korean BBQ spot training a new server on a tabletop grill safety routine, or a bubble tea shop where half the staff communicate more comfortably in Mandarin or Vietnamese than English.
Owner-operators in this sector are pulling from a smaller, often bilingual labor pool, and they're training people on service models — all-you-can-eat pricing, shared hot pot burners, lazy-susan seating for eight to ten guests at a table — that don't exist at a typical American casual-dining chain. That means training takes longer, mistakes during the first few weeks are more expensive, and turnover costs more each time it happens, because the next hire has to be trained on the same unusual workflow from zero.
This shows up as a manager who spends two hours a night doing the job of a scheduling system, a server who takes an extra 90 seconds per table explaining a menu that was never translated, and a kitchen that runs slower during a rush because the person on expo can't read half the tickets clearly.
Picture a new server's first solo Saturday at a Korean BBQ restaurant that seats ninety. She's fluent in Korean and conversational in English, hired three weeks earlier, and tonight is the first shift without a trainer shadowing her. The POS is entirely in English, the tabletop grill protocol was explained once during a rushed orientation, and the menu has forty items she hasn't fully memorized yet. Every unfamiliar screen and every guest question she has to answer in her second language adds seconds to a table interaction that a native English speaker on a simpler menu wouldn't lose. Multiply that across twelve tables during a two-hour rush, and the restaurant isn't short-staffed because it lacks a body on the floor — it's short-staffed because the one body it has is running at a fraction of the speed the system assumes she should be running at.
Look closely at a mid-sized Asian restaurant's labor allocation and the same patterns show up again and again.
The first is duplicate data entry. A restaurant running a stand-alone POS, a separate online ordering system, and two or three delivery apps needs someone — usually a manager, sometimes the owner — manually keying menu updates, price changes, and 86'd items into every system separately. Change the price of a hot pot combo during a slow Tuesday promo, and that's four separate updates instead of one. Multiply that across a menu with 80–150 items and seasonal specials, and it's hours a week that produce zero revenue.
The second is manual scheduling and shift coverage. Without a system that tracks sales patterns by day and hour, most owner-operators schedule by instinct and adjust reactively — which tends to mean overstaffing on quiet nights and understaffing during unexpected rushes. A restaurant that can see its own order-volume data by hour, by day of week, and by season can staff much closer to actual demand, which is one of the more direct answers to how to reduce restaurant labor cost without cutting service quality.
The third is order-taking itself, which is where the labor shortage bites hardest during a dinner rush. A server who has to walk to every table, take an order verbally, walk it back, and re-key it into a POS terminal is doing three jobs a self-ordering kiosk or a table-side QR code can absorb. That doesn't mean removing servers from the floor — it means freeing them to focus on service, refills, and problem-solving instead of data entry.
A fourth pattern shows up less often in conversation but costs just as much: inventory and vendor reconciliation done by hand because sales data lives in one system and purchasing records live in a notebook or a separate spreadsheet. An owner who can't see which dishes actually sold last week without manually cross-referencing two sources is making purchasing decisions on memory instead of data, which tends to mean over-ordering perishables that get thrown out or under-ordering a dish that's selling better than expected and running out of it mid-rush. That waste and those stockouts are a labor cost in disguise, because someone still has to notice the problem, explain it to the kitchen, and improvise a fix in real time.
There's a fifth, quieter cost tied directly to how often all of the above has to be repeated: recruiting itself. Every departure means writing or reposting a job listing, screening candidates, and running interviews — hours of manager or owner time that produce no covers served and no revenue, on top of whatever the eventual hire's own ramp-up costs once they start. A restaurant losing staff every few weeks isn't just paying a slower new hire; it's paying the recruiting cycle over and over, which is its own hidden line item buried inside general payroll administration rather than broken out anywhere on a P&L.
Ask most owner-operators how they build next week's schedule, and the honest answer is usually "the same as last week, plus or minus a gut feeling." That approach isn't unreasonable when demand is predictable, but the NRA's finding that 60% of operators saw softer traffic in 2025 than the year before, cited earlier in this white paper, means the baseline itself has been shifting under a lot of restaurants without anyone noticing until the schedule is already wrong for two or three weeks running.
A dim sum restaurant is a useful example of how badly instinct-based scheduling can miss the actual demand curve, because dim sum traffic is unusually concentrated. A typical week might see three-quarters of the weekend's covers arrive in a four-hour window on Saturday and Sunday mornings, with weekday lunch running at a fraction of that volume and weekday dinner even lighter. An owner scheduling by feel tends to schedule roughly the same cart-service and server headcount across every lunch shift, because that's the shift they're used to thinking about as "lunch," rather than recognizing that Tuesday lunch and Sunday lunch are functionally two different businesses with two different labor needs.
The fix isn't more staff meetings about scheduling — it's visibility into the restaurant's own order-volume data by hour and by day, which most modern POS systems already collect but don't always surface in a usable way. Once an owner can see that Sunday's 10 a.m. to 2 p.m. window reliably does three times the volume of Tuesday's same window, staffing decisions stop being a guess and start being a direct response to a pattern the restaurant has already lived through dozens of times.
The payoff shows up on both ends of the labor-cost benchmarks cited later in this chapter. Overstaffing a slow shift pushes a restaurant's labor-cost percentage toward the loss-making end of the range Toast's data describes; understaffing a busy one pushes service quality down at the exact moment the restaurant has the most covers, and the most reviews, riding on it. Scheduling to the actual demand curve is one of the few labor fixes that improves the cost side and the service side at the same time, rather than trading one for the other.
The labor shortage restaurant owners feel isn't a perception problem — it shows up clearly in national data, and it explains why relying on hiring alone to fix a staffing gap is a losing strategy. The National Restaurant Association's 2026 outlook found that nearly three-quarters of operators plan to hire this year but expect real difficulty finding experienced managers and chefs specifically — not entry-level line cooks or hosts, but the roles a restaurant depends on most to run smoothly without an owner standing over every shift.
Turnover compounds the shortage rather than sitting separate from it. According to the U.S. Bureau of Labor Statistics' Job Openings and Labor Turnover Survey, the quits rate for the Accommodation and Food Services industry was 3.5% in July 2026, down from 4.1% in June — a rate that remains among the highest of any major industry even after that improvement. Every one of those departures resets the training clock for whoever replaces them, and at an Asian restaurant running a bilingual, format-specific service model, that training clock is longer to begin with than it would be at a generic casual-dining chain.
Payroll data shows exactly how much is riding on shaving even a few points off labor cost as a share of sales. Restaurant payroll-cost benchmarks compiled by Toast from National Restaurant Association data show that at limited-service restaurants, profitable operators run about 30.0% of sales in labor cost, the average across all respondents is 31.7%, and restaurants operating at a loss average 34.1%. At full-service restaurants — the format most hot pot, Korean BBQ, and Chinese banquet-style concepts fall into — profitable operators run about 34.2%, the all-respondent average is 36.5%, and restaurants operating at a loss average 42.9%.
Look closely at the gap in that full-service data: the difference between a profitable full-service restaurant and one operating at a loss is 8.7 points of labor cost as a share of sales. That's not a rounding error — on a restaurant doing $2 million a year in sales, 8.7 points is $174,000. Some of that gap is genuinely about wage rates and local market conditions an owner can't control. But a meaningful share of it is the duplicate data entry, manual scheduling, and slow order-taking described above — hours paid for that a system could absorb, still showing up on the labor line every single pay period.
This data isn't broken out by cuisine, because no major national survey segments the industry that finely. But full-service formats with multi-course meals, shared cooking, and larger group tables — exactly the formats common at hot pot, Korean BBQ, and traditional Chinese restaurants — sit structurally on the more labor-intensive side of the numbers above, which means the payroll-percentage gap between a well-run and a poorly-run operation is likely to be even wider in this sector than the national full-service average suggests.
Turnover doesn't just create a hiring problem — it resets a cost that most restaurants never actually calculate: the gap between a new hire's first day and the day they're contributing at full speed. At a generic casual-dining restaurant with a simple per-item menu and an English-only staff, that ramp-up might take a week. At a hot pot or Korean BBQ restaurant running a bilingual, multi-step service model with grill or pot safety protocols, group billing, and a menu with regional dishes a new hire may never have served before, that same ramp-up commonly stretches to three or four weeks before a server is working at the pace an experienced one does.
Put a number on that gap using the quits-rate data cited earlier. The U.S. Bureau of Labor Statistics' JOLTS data shows a 3.5% monthly quits rate in the Accommodation and Food Services industry as of July 2026. Applied to a restaurant with a twenty-person staff, that works out to roughly one departure a month on average, which means the restaurant is very often carrying at least one employee somewhere in that three-to-four-week ramp-up window at any given time — not as an occasional disruption, but as a near-constant background cost.
A new hire running at roughly half productivity for three weeks, on a wage of $18 an hour for a 30-hour week, represents about $1,620 in paid labor for that stretch, against roughly $810 of it as the effectively wasted half — before counting the manager or trainer hours spent actively teaching rather than running the floor. Multiply that by the roughly twelve departures a twenty-person staff might see across a year at the cited quits rate, and the ramp-up cost alone lands in the range of several thousand dollars annually. It never shows up as a distinct line item, because it's buried inside ordinary payroll rather than broken out anywhere.
This is exactly where a multilingual interface and simplified, format-specific training materials pay for themselves fastest. Cutting the ramp-up window from four weeks to two doesn't just get a new hire to full speed sooner — it directly cuts the number of weeks per year the restaurant is carrying reduced-productivity labor, and that reduction compounds every time turnover happens again, which the data above says will be often.
Every restaurant competes for labor against every other employer offering a similar wage in the same neighborhood, not just against other restaurants. For an Asian restaurant depending on bilingual staff, that competition is often narrower and more direct than it looks from the outside — the same pool of Mandarin, Cantonese, Korean, or Vietnamese speakers with restaurant experience is frequently being recruited by nearby retail stores, other restaurants in the same cuisine, and community-adjacent businesses all drawing from the same local network at once.
That narrower pool is part of why the national quits rate cited earlier in this chapter tends to understate the churn a bilingual-dependent restaurant actually experiences. A restaurant that loses a bilingual server or kitchen lead isn't just replacing a position — it's competing to re-fill a specific kind of position against every other business drawing from the same community network, often through word of mouth rather than a job board that reaches a broader applicant pool.
This is exactly where lowering the language barrier for hiring changes the competitive picture rather than just improving day-to-day efficiency. A restaurant that can only train new hires on an English-only system is limited to a narrower slice of an already-tight labor pool for many of its higher-skill roles. A restaurant that can bring on a strong candidate who is confident in Chinese, Korean, or Vietnamese but still building English fluency, and get that person fully productive within days on a system available in their language, has effectively widened its own hiring pool at the exact moment the rest of the local labor market is fighting over the same narrow one.
A handful of tools consistently show up in restaurant labor shortage solutions that actually work at Asian restaurants, rather than solutions borrowed wholesale from generic QSR chains.
Self-ordering kiosks absorb order volume during the exact hours labor is hardest to staff. At a bubble tea shop or fast-casual concept, a kiosk handles the straightforward, repeatable orders — freeing the one or two staff on shift to handle drink prep, exceptions, and the occasional customer who needs help. The labor saved isn't a full position eliminated; it's the difference between needing three people on the counter during a rush and needing two.
Table-side and QR ordering shortens the path between a guest being ready to order and the kitchen having the ticket, which matters even more at hot pot and AYCE restaurants where guests order in rounds throughout the meal rather than once at the start. A server who isn't manually re-taking a second and third round of orders is available for more tables per hour.
A multilingual, unified interface — order-taking, kitchen display, and back-office reporting available in English, Chinese, Japanese, Korean, and Spanish from the same system — cuts new-hire training time significantly, because staff aren't learning both the job and an unfamiliar English-only interface at the same time. It also opens up hiring to a wider pool of candidates who are strong workers but less confident in English, which matters directly in a labor market where the shortage of available staff is the real constraint.
The training-time effect is easy to underestimate until you watch it happen twice. A bubble tea shop owner in a mid-size city hired two new counter staff the same week — one trained on a system with an English-only interface, one trained on a multilingual one. The first spent most of her first three shifts asking a manager how to ring up modifiers and process a refund. The second was running the register solo by her second shift, because the training material and the screen in front of her were both in the language she was most confident in. That's not a hypothetical efficiency gain; it's the difference between a manager babysitting a register for three shifts and a manager who gets those hours back to run the floor instead.
Back-office reporting that pulls from the same order and sales data as the front end removes a different kind of labor cost entirely — the owner's own unpaid hours. A manager who can see sales by hour, by day, and by item from a single dashboard doesn't need to build that picture manually from register tapes and a spreadsheet at the end of each week. That's not a front-of-house labor saving that shows up in a payroll report; it's hours returned to the person running the business, who is often the person with the least slack in their schedule to begin with.
Even with faster ramp-up times and a wider hiring pool, turnover at the rate described earlier in this chapter is going to keep happening. The restaurants that handle it best don't just train faster — they train more staff on more of the workflow, so a single departure doesn't leave a gap only one specific person could fill.
A hot pot or Korean BBQ restaurant where only two servers know how to run the grill-safety walkthrough for new tables, or only one host knows how to manage the digital waitlist during a packed Saturday, has built a fragile system regardless of how efficient any individual tool is. The efficiency gains described throughout this chapter compound fastest when more than one person on a given shift can perform each critical task, because that's what actually protects the restaurant against the next departure, not just against today's staffing level.
A unified, multilingual system makes this kind of cross-training realistic in a way a fragmented one doesn't. When the interface and the workflow are the same across every role that touches it, teaching a second or third staff member to cover a task is a matter of showing them a screen they may have already seen used elsewhere in the restaurant, rather than introducing them to an entirely separate system they've never touched. That's a modest-sounding difference that adds up to real staffing resilience over a full year of ordinary turnover.
Before adopting anything marketed as a labor-cost solution, run it through a short set of questions specific to how an Asian restaurant actually operates, rather than taking a vendor's generic ROI claim at face value.
Does it reduce a task, or just move it? A kiosk that takes orders but still requires a staff member to manually key them into a separate kitchen system hasn't removed labor — it's relocated it. The systems that actually help eliminate the re-entry step entirely, not just the customer-facing part of it.
Does it match the actual service model? A tool built around a single per-guest check doesn't map cleanly onto AYCE pricing, shared hot pot pots, or group billing with a lazy susan. Confirm the system handles the pricing and seating structure the restaurant actually runs, not a generic restaurant template.
Does it shorten training time or lengthen it? If a new system requires a full day of training before a hire can use it independently, it's adding to the labor problem, not solving it. The right system should be usable by a new hire within an hour or two, especially when the interface is available in the language they're most comfortable working in.
Does it reduce the hours a manager or owner personally spends on administrative work? A lot of labor-savings marketing focuses on front-of-house headcount, but for a small owner-operated restaurant, the hours the owner or manager spends on scheduling, menu updates, and reconciling numbers across systems are just as real a labor cost — they're just unpaid overtime instead of a line item.
Does it hold up on the highest-volume shift of the week, or only in the vendor's demo? Plenty of tools perform well when a restaurant is running at half capacity and fall apart the moment order volume triples on a Friday or Saturday night. Ask specifically how the system behaves when the kitchen display, the online ordering feed, and in-person orders are all hitting it at once, because that's the exact moment labor is already stretched thinnest, and the worst possible time to discover a tool doesn't scale.
Disconnected systems don't just create more work — they concentrate that work in one person, usually the manager or owner, because nobody else on staff has been trained across every disconnected tool well enough to touch all of them. That concentration creates a single point of failure that has nothing to do with how good that manager is at the job.
A restaurant where only the manager knows how to update the delivery-app menus, reconcile the online ordering platform, and fix a frozen kitchen printer is a restaurant that can't function normally on the one night that manager is sick, on vacation, or simply pulled away to handle something else. Every other staff member on shift is capable of running service, but the administrative and technical layer running underneath service is invisible to them, because it was never simple enough to teach broadly.
A unified system changes who can hold that knowledge. When menu updates, reporting, and troubleshooting all happen inside one interface instead of four, training a second person to handle those tasks stops being a multi-week project and becomes something a capable shift lead can pick up in a few sessions. That redundancy matters as much as any efficiency gain described earlier in this chapter, because a restaurant that depends entirely on one person's accumulated, undocumented knowledge of four different systems is one bad week away from a genuine operational crisis, not just an inconvenience.
Labor is the most visible operational pain point for most Asian restaurant owners, and it's also the one with the clearest fixes: reduce duplicate work, match staffing to real demand data, and lower the language and training barrier that makes hiring harder than it needs to be. But labor efficiency only gets a restaurant partway there. The next question is what happens once a guest is actually seated — because a fully staffed restaurant that still turns tables slowly is leaving just as much money on the table.
A restaurant with a line out the door on a Saturday night looks like a success story from the sidewalk. Inside, it can just as easily be a restaurant that's about to lose half of the guests standing outside, because the tables that should have turned twenty minutes ago are still occupied. Nobody's lingering over dessert — nobody has come to take a second round of orders, the food that's ready has been sitting under a heat lamp, and the check for table 12 has been sitting in a booth waiting to be picked up for ten minutes.
Generic restaurant benchmarks about how fast a table "should" turn don't map cleanly onto most Asian restaurant formats, and applying them directly leads owners to chase the wrong fix. A hot pot table with two people cooking their own meal over ninety minutes isn't underperforming — that dwell time is the product. An AYCE restaurant's whole value proposition depends on guests staying long enough to feel like they got their money's worth. A ten-top at a Chinese banquet-style restaurant with a lazy susan naturally takes longer to seat, order, and settle than a four-top ordering off a fixed menu.
The real question isn't how to increase table turnover restaurant-wide by rushing every guest out the door. It's how to strip out the time that has nothing to do with eating — the minutes lost waiting for a server, waiting for food to actually reach the table once it's ready, and waiting to pay — without touching the part of the meal the guest is actually there for.
Bubble tea shops sit at the opposite end of the spectrum, and the mismatch runs the other direction. Here, most transactions are meant to move fast — a drink ordered, made, and handed over in a handful of minutes — so the bottleneck isn't dwell time at a table, it's throughput at the counter during a three o'clock rush when half the local high school shows up at once. Applying a full-service turnover framework to a bubble tea counter misses the point entirely; the metric that matters is drinks completed per hour during peak windows, not minutes per table, because most of the seating in these shops is incidental to the transaction rather than central to it.
Korean BBQ occupies a middle ground that its own operators often underestimate. A table isn't just occupied for the length of the meal — it needs time between parties to change the grill plate or clean the built-in ventilation system, on top of the ninety minutes to two hours a typical grill-your-own meal runs. An operator benchmarking against a standard casual-dining turnover number will always look slow by comparison, and chasing that number by rushing the changeover is more likely to produce a burn complaint or a guest who feels hurried through a meal built around lingering over shared plates.
Watch a full dining room during a rush and the order doesn't stall in one obvious place. It stalls at the point where a guest is ready to order a second round but every server is already carrying plates to another table. It stalls at the pass, where finished dishes sit because whoever's supposed to run them is still taking an order somewhere else. And it stalls at the end of the meal, when a table is ready to leave but the check hasn't been dropped, or it has been dropped and now sits untouched because the guest needs someone to come back and run a card.
These delays rarely show up as a formal metric most owners track. They show up as guests glancing at the door, a line forming that never quite clears, and a dining room that looks packed on paper but is actually running well under its real seating capacity for the night.
At a hot pot or AYCE concept specifically, the ordering pattern makes this worse than at a typical restaurant. Guests order in rounds throughout the meal instead of once at the beginning, so every round is a fresh opportunity for the order to sit waiting on server availability. A restaurant doing sixty covers a night on a four-hour dinner service might be running two or three separate ordering rounds per table — which means the bottleneck at server availability isn't an occasional problem, it repeats every fifteen to twenty minutes at every table in the room.
A Friday night at a full-service Chinese restaurant with six ten-tops running simultaneously makes the same bottleneck visible at a larger scale. Each table might flag a server four or five separate times over the course of the meal — to order, to request a refill, to ask for another dish, to request the check, to ask again because nobody came the first time. With three servers covering the floor, that's somewhere between twenty and thirty individual "guest is waiting for attention" moments happening across a single dinner service, each one a small delay that compounds with the others into a dining room that feels chaotic even when every server is working at full speed.
Every delay described so far has a front-of-house symptom — a guest waiting, a check sitting untouched — but the mechanism usually starts in the kitchen, where a disconnected system creates a completely different set of problems that never reach the dining room directly.
A kitchen running on printed tickets with no routing logic has to solve, manually and in real time, a problem a synced system solves automatically: which dishes belong together, which station should fire them, and in what order they need to go out so an entire table's food arrives at once rather than in a scattered sequence. During a hot pot or Korean BBQ rush, where a single table's order might span appetizers, proteins, vegetables, and sauces coming from three different stations, that coordination problem multiplies with every additional table in the queue. A kitchen that's slightly behind on ticket sorting doesn't just run five minutes late — it runs progressively later as tickets pile up faster than anyone can manually sequence them correctly.
The expo position absorbs most of this pressure, and it's usually the least visible role in the whole operation from a guest's seat. An expo who's also functioning as an unofficial dispatcher — deciding which runner takes which dish to which table, because the system isn't doing that automatically — is doing coordination work on top of the actual expo job of checking plates before they leave the kitchen. When that person falls behind, the visible result several minutes later is a dining room where dishes sit at the pass and guests wonder why food they can see is ready isn't reaching their table.
A kitchen display system connected directly to the ordering platform removes the manual sequencing problem rather than making the person doing it faster. Tickets route to the right station automatically, dishes for the same table get grouped and flagged as a unit, and the expo role goes back to being quality control rather than real-time logistics dispatch under pressure. That's a kitchen-side fix, but its effect is entirely visible from the dining room — food reaches the table closer to the moment it's actually ready, which is one of the specific delays identified earlier in this chapter.
National data puts real numbers on how differently service formats are supposed to turn, and it helps to know where a given Asian restaurant format actually sits before setting a turnover target. Benchmark data compiled by Toast shows that family-style restaurants average about three table turns during a five-hour dinner service window, meaning a table flips roughly every ninety minutes. Fast-food and quick-service formats turn far faster, ranging from thirty to sixty minutes per table — twelve to twenty-four turns across a twelve-hour operating day. Fine-dining restaurants sit at the other extreme, typically seeing only one to two turns per service.
Map the formats common in this sector onto that spectrum and the target turnover time becomes clearer. A hot pot or Korean BBQ restaurant, with its ninety-minute-plus dwell time built around shared cooking, sits closest to the family-style benchmark of roughly ninety minutes per turn — meaning a well-run hot pot restaurant isn't failing if it gets three turns in a five-hour dinner service; it's hitting the same mark a family-style restaurant hits nationally. A bubble tea or fast-casual Asian concept, by contrast, should be measuring itself against the quick-service range of thirty to sixty minutes and twelve-plus turns a day, because its format and price point are built for volume, not dwell time. A traditional full-service Chinese restaurant with banquet-style group tables often lands between the two, closer to family-style than quick-service, but with more variance depending on party size and whether the visit is a quick weeknight dinner or a multi-course weekend gathering.
The mistake most owners make is picking one national number — often a generic casual-dining average somewhere around an hour — and applying it uniformly across every table and every night of the week, regardless of format. A hot pot restaurant chasing a sixty-minute turn on a table that's supposed to run ninety minutes isn't improving efficiency; it's fighting its own business model, and the guests who feel rushed out the door are the ones who leave the review that says so. The right benchmark is format-specific, and the fixes described later in this chapter are aimed at removing wasted time within that benchmark, not at compressing a meal into less time than its format was built for.
AYCE restaurants deserve a closer look on their own, because the pricing model doesn't just affect how long guests stay — it changes what "efficient" even means for the kitchen and the front of house simultaneously. A per-item restaurant makes more money serving more dishes; an AYCE restaurant's margin depends on the opposite discipline, controlling portion sizes and pacing orders so guests eat well without over-ordering food that goes to waste.
That creates a specific tension with the turnover fixes described elsewhere in this chapter. Table-side ordering that makes it effortless for a guest to order round after round is exactly right for reducing wait-on-server delay, but it also needs pacing logic behind it — order limits per round, a kitchen view of how many active rounds a table has already ordered — so the same tool that speeds up service doesn't also quietly erode the margin the AYCE pricing model depends on. A system built for a standard per-item restaurant and simply repurposed for AYCE without that pacing awareness solves the turnover problem while creating a new food-cost problem.
The restaurants that run AYCE most profitably tend to track two numbers most other formats don't need to watch as closely: average rounds ordered per table, and average food cost per cover against the fixed price point. Both depend on the same order-level data a synced kitchen display and ordering system already generate, which means the reporting doesn't require a separate tool — it requires making sure whatever system is already tracking orders is actually surfacing this specific view rather than just recording transactions.
Get the pacing right, and AYCE turns into one of the more predictable formats to run, precisely because the price point removes menu-item variability from the revenue side of the equation — a table's spend is fixed regardless of what they order, so the entire operational focus can shift to the turnover and food-cost mechanics described here, which is a cleaner problem to manage than the continuous demand forecasting a per-item restaurant has to do.
Not every seat in a restaurant fills the same way, and treating reservations and walk-ins as interchangeable is another place where turnover math goes wrong. A restaurant running a heavy reservation book for a Saturday banquet crowd has a fundamentally different turnover challenge than one filling primarily from walk-in traffic, even if both are hitting the same total covers for the night.
A reservation-heavy night is a scheduling problem before it's a service-speed problem. If reservations are booked back-to-back without accounting for the format's actual dwell time — ninety minutes for a hot pot table, longer for a large banquet party with a lazy susan — the restaurant has built a bottleneck into its own booking system before a single guest walks in, and no amount of table-side ordering or kitchen-display efficiency can fix a reservation calendar that was never realistic to begin with.
A walk-in-heavy night puts the pressure in a different place entirely: the host stand and the waitlist, where the guest-patience data cited below applies most directly. Here, the fix is less about the booking calendar and more about managing the queue itself — accurate wait-time estimates, and a way for waiting guests to hold their place without physically standing in a crowded entryway.
Most Asian restaurants in this sector run some mix of both, which means the turnover strategy that works isn't a single tactic but a system that handles reservations realistically against actual format dwell time while also managing a walk-in queue efficiently on the same night, often for the same limited pool of tables. Treating the two as one undifferentiated stream of "covers to seat" is where a lot of otherwise sound turnover fixes stop delivering their expected return.
Turnover isn't only a kitchen and floor-staff problem — it's also a function of how long a guest is willing to wait before walking away, and that patience has a measurable limit. The same Toast benchmark data shows that 72% of guests will wait no more than thirty minutes for a table. Past that point, a restaurant isn't just risking a bad review — it's actively losing the guest standing at the host stand, along with everyone in that party.
How a restaurant manages that thirty-minute window matters as much as the wait time itself. The data shows 59% of guests aged 18 to 34 prefer a mobile waitlist or text-message option over standing and waiting physically near the host stand. For a hot pot or Korean BBQ restaurant with a younger customer base and predictable weekend queues, that preference is directly actionable: a guest who can put their name on a list by phone and get a text when their table is ready will wait longer, and more patiently, than one standing in a crowded entryway watching every party ahead of them get seated.
That same comfort with phone-based interaction extends past the waitlist and into how guests want to interact with the restaurant once they're inside. The National Restaurant Association's Restaurant Technology Landscape Report found that 82% of Gen Z adults are comfortable placing an order via smartphone app at a limited-service restaurant, and 65% of adult consumers are comfortable paying their check via tablet at a full-service restaurant. A restaurant that still relies exclusively on a human being to greet, seat, order, and collect payment at every single touchpoint is asking guests to interact in a way a majority of them are already comfortable skipping, and doing so with a labor force that's harder to staff than it's been in years, per the labor data in Chapter 1.
This doesn't mean removing the host stand or the server from the experience. It means giving guests the option to spend their waiting time and their in-restaurant time the way most of them already say they'd prefer, while keeping staff available for the moments — a special request, a problem with an order, a first-time guest who needs guidance through an unfamiliar menu — where a person genuinely matters more than a screen.
A restaurant that treats every night as the same turnover problem is usually solving the wrong one at least half the time. Weeknight and weekend service put pressure on completely different parts of the system, and a fix built for one can be irrelevant, or even counterproductive, on the other.
On a slow Tuesday, tables aren't turning slowly because of a bottleneck — they're turning slowly because there isn't enough guest volume to fill the room, and the handful of tables that are seated have no reason to rush. The relevant problem on a weeknight isn't order flow; it's labor scheduling, which loops back to the manual, instinct-based scheduling problem described in Chapter 1. A restaurant that's overstaffed on a Tuesday because nobody adjusted the schedule down from Saturday's staffing level is losing money to labor cost that weekend-focused turnover fixes won't touch at all.
On a Friday or Saturday, the problem flips entirely. Now there's more guest demand than the dining room can absorb at once, and every minute a table sits occupied past its natural cycle is a minute a waiting party spends deciding whether to stay or leave, per the guest-patience data cited above. This is where the fixes from earlier in this chapter — table-side ordering, a synced kitchen display, a digital waitlist — earn their return, because the constraint on a weekend night is cycle speed — a different lever entirely from whether enough staff are scheduled.
Treating these as the same problem leads to two common mistakes: staffing every night at weekend levels, which wastes labor on slow nights, or applying weekend turnover pressure — rushing guests, minimizing table time — on a weeknight where it isn't needed and only damages the guest experience. The restaurants that manage this best track both patterns separately and apply the labor fix on slow nights and the turnover fix on busy ones, rather than picking one system-wide policy and running it every night of the week regardless of actual demand.
A slow turnover cycle doesn't only cost the covers a restaurant fails to seat that night — it can cost the guest entirely, in a market where the National Restaurant Association's 2026 data already shows 60% of operators fighting softer traffic than the year before. A party that leaves a long line because the wait exceeded the roughly thirty-minute patience threshold described earlier in this chapter, per Toast's benchmark data, doesn't necessarily come back to try again on a quieter night. They eat somewhere else, and some share of them simply become a different restaurant's regular from that point forward.
That risk compounds specifically because the same NRA data shows more than 7 in 10 consumers say they'd eat out more often given more disposable income — meaning the guests a slow-turning restaurant is losing to a bad wait experience are guests who are already budget-conscious about how often they eat out at all. Losing that visit to a competitor isn't a neutral swap; it's losing a customer who was already being selective about where their limited dining budget goes, at a moment when a smoother experience might have turned a first visit into a habit.
This is the piece of the turnover conversation that's hardest to put a precise dollar figure on, because it requires knowing what a lost guest would have spent over years of repeat visits rather than what one seated table generates in one night. But the mechanism is straightforward enough that it doesn't need an invented statistic to make the point: every guest who leaves the line during a preventable wait is a guest the restaurant paid to attract — through marketing, through location, through reputation — and then lost for free, at the exact stage of the visit that has nothing to do with the food.
Large-party and private-room bookings, common at full-service Chinese restaurants hosting birthday banquets and company dinners, deserve separate treatment from the standard table-turnover conversation, because the economics and the service flow both work differently at that scale.
A twelve-top private room booked for a three-hour banquet isn't inefficient if it only turns once that night — the value of that single booking, in total spend, often exceeds several turns of a standard four-top. But the operational mechanics inside that booking still carry the same order-flow risks described earlier in this chapter, magnified by scale: a coordinated multi-course banquet menu requires the kitchen to pace ten or twelve dishes correctly across a single service window, and a server managing that room alone is handling the equivalent workload of covering three or four standard tables at once.
A synced kitchen display and ordering system matters even more in this setting than at standard tables, because a banquet's course-by-course pacing depends entirely on the kitchen and the front of house staying coordinated in real time — a dish that comes out too early or too late doesn't just inconvenience one table, it disrupts the flow of an event the host is often paying a premium to have run smoothly. Restaurants that treat private-room bookings as just larger versions of standard table service, without dedicated attention to that pacing coordination, tend to see the most guest complaints concentrated exactly there, even when the rest of the dining room runs cleanly the same night.
The fixes that move table turnover at Asian restaurants specifically tend to remove a step rather than speed one up.
Table-side and restaurant qr code ordering systems let a guest place a second or third round the moment they're ready, without waiting for a server to notice and come over. That single change removes the biggest variable in an AYCE or hot pot restaurant's ordering cycle, because it takes the timing of each round out of server bandwidth and puts it in the guest's hands.
A kitchen display system that's actually synced to the ordering system — rather than a printer spitting out tickets that a runner has to sort manually — cuts the gap between food being ready and food reaching the table. Dishes get grouped and routed correctly the first time instead of sitting at the pass while someone figures out which table ordered what.
For counter-service and fast-casual Asian concepts, a customer pickup screen replaces a staff member calling out names or numbers over the noise of a packed dining room. Guests know when their order is ready without crowding the counter or interrupting staff mid-prep, which keeps the line moving even during a lunch rush.
Integrated, table-side payment closes the loop on the part of the meal that has nothing to do with food at all: settling the check. A guest who can pay from the same device they ordered from doesn't have to flag someone down, wait for a card machine to be free, or sit with a closed check for ten minutes because the restaurant is short-staffed at the exact moment the table wants to leave.
A digital waitlist that sends a text when a table is ready addresses the front end of the cycle the same way table-side ordering addresses the middle of it. Instead of a host physically scanning a crowded lobby every few minutes trying to spot which party's turn is next, the system tracks it automatically and frees that host to actually manage the flow of guests coming in, which matters most on exactly the nights when the line is long enough for it to matter.
Before treating any of the above as a guaranteed fix, it helps to check it against how the restaurant actually runs.
Does the fix respect the meal format, or fight it? A hot pot restaurant doesn't need guests to eat faster — it needs the non-eating parts of the visit to move faster. Any change that pressures guests to finish a shared pot faster will damage the experience the restaurant is actually selling.
Does it reduce the number of times a guest has to get a staff member's attention? Every point where a guest needs someone to notice them — to order, to get food, to pay — is a point where the whole cycle can stall. The most effective fixes remove those moments rather than making staff faster at responding to them.
Does the kitchen actually see the change, or just the front of house? A restaurant qr code ordering system that speeds up how guests place orders doesn't help if the kitchen still receives those orders on a printer with no routing logic. The gain only shows up if the system connects all the way through to food prep and expo.
Does the fix hold up during the exact rush it's meant to solve? A waitlist or ordering tool that works cleanly with ten tables seated can behave very differently once forty are seated at once and the wireless network, the kitchen display, and three staff tablets are all pulling from the same connection simultaneously. Ask how the system performs specifically at the volume it needs to handle on a Friday or Saturday, not at the volume it's demoed at.
Faster turns free up the physical capacity a restaurant already has — more covers per shift, from the same dining room, without adding seats or staff. But turnover and labor efficiency both still assume the restaurant is running one set of tools well. The next question is what it costs to keep several disconnected tools running at once instead — and what actually changes when they're replaced with one.
Once a month, most owners sit down to pay for everything that keeps the restaurant running online — not payroll, but software. A fee for the point of sale. A fee for the online ordering platform. A fee for a loyalty app. A cut handed to each delivery app on every order it brings in. Individually, none of these charges look large. Add them up over a year, and they're usually one of the least visible line items on the P&L — and one of the easiest to shrink once someone actually does the math.
A restaurant running a stand-alone POS, a separate online ordering tool, a loyalty app, and two or three delivery platforms is paying for all of them whether or not they're used efficiently. Each one bills monthly regardless of order volume, and none of them share a login, a menu, or a customer record with the others.
The most visible cost is the commission on third-party delivery orders, typically 25–30% per order. That's not a one-time fee — it scales with growth, so the restaurants growing fastest through delivery apps are often the ones losing the most to commissions.
The less visible cost is what happens when systems don't share data. A loyalty program that can't see POS purchase history can't tell the difference between a guest who orders takeout weekly and someone who's never been in before — so the restaurant ends up marketing to everyone the same way, or not marketing in any targeted way at all. And at the end of every month, someone still has to export sales data from three or four different dashboards and manually reconcile them before the numbers mean anything, which is hours of unpaid administrative work with no revenue attached to it.
There's a third cost that rarely makes it onto a spreadsheet at all: the hardware and integration debt that builds up around disconnected systems. A separate tablet for each delivery app, a dedicated terminal for online ordering, and a POS that doesn't talk to either one means more devices to charge, update, and troubleshoot, and more points of failure on a busy night. When one of those devices goes down mid-shift — a delivery tablet freezes, a printer jams — it's often the owner or manager who ends up debugging hardware instead of running the floor, because nobody else on staff has been trained on four different systems well enough to fix any of them under pressure.
The alternative to consolidating systems isn't a neutral, cost-free option — it's a default that keeps accumulating the costs described throughout this chapter, quietly, for as long as the status quo continues. An owner weighing whether switching platforms is worth the disruption is really weighing a one-time, planned transition cost against an open-ended, ongoing cost that doesn't stop simply because nobody's decided to address it yet.
Delivery commissions are the clearest example, because they scale with growth rather than staying fixed. A restaurant doing $20,000 a month in third-party delivery volume today and growing that channel 20% a year is paying a proportionally larger commission bill every year it delays consolidating its ordering channels, not a flat, predictable cost that switching later resets to zero. The restaurants that wait the longest to address delivery-commission dependence are, by definition, the ones for whom the eventual fix has the biggest single-year impact — and also the ones who've paid the most in commissions in the meantime.
Labor cost behaves similarly. Every new hire trained on a fragmented, multi-system setup instead of a unified one is a hire who will eventually need to be retrained anyway, whenever the restaurant does consolidate — meaning delay doesn't avoid the retraining cost, it just pushes it to a future date and adds more staff to the list of people who'll need it. The restaurants that consolidate earlier train each new hire once, on the system they'll actually keep using.
This isn't an argument for switching systems reflexively or without a plan — the framework for evaluating ROI claims later in this chapter still applies in full. It's a reminder that "we'll deal with it later" has a real, compounding cost of its own, and that cost belongs in the same comparison as the cost and disruption of actually making the change.
The pressure to consolidate isn't happening in a vacuum — the rest of the industry is already moving toward more integrated technology, which means a restaurant standing still on this front is falling behind its own competitive set, not just missing an optional upgrade. The National Restaurant Association's Restaurant Technology Landscape Report found that 55% of operators are planning investments specifically to improve service areas, and 60% are looking for technology that enhances the customer experience directly. This is the majority of the industry actively investing in the same direction, not a small, early-adopter niche.
That investment is paying off in a way operators can measure themselves: the same report found that more than three in four operators say technology gives them a competitive edge. And the industry isn't only investing in customer-facing convenience — 16% of operators reported plans to invest in AI integration, including voice recognition, signaling that the more advanced end of restaurant technology is moving from novelty into mainstream adoption faster than most owner-operators may realize.
Guest behavior backs up why that investment makes sense. The same NRA report found that 82% of Gen Z adults are comfortable placing an order via smartphone app at a limited-service restaurant, and 65% of adult consumers are comfortable paying their check via tablet at a full-service restaurant. A restaurant weighing whether to invest in self-ordering or table-side payment isn't betting on an unproven behavior change — it's catching up to a preference the majority of its own guests have already told researchers they hold.
For an Asian restaurant specifically, this backdrop cuts two ways. On one hand, guests — particularly younger ones — arrive already comfortable with the kind of ordering and payment technology that solves the labor and turnover problems described in the first two chapters, which lowers the adoption risk considerably. On the other hand, a generic, English-only version of that technology, bolted onto a restaurant without addressing the multilingual staffing and non-standard service model described in Chapter 1, captures only part of the available return. The restaurants getting the full benefit of this industry-wide shift toward technology are the ones matching the tool to the format, not just adding a tool because the rest of the industry is adding one.
The labor and turnover gains from the first two chapters don't operate in isolation — they compound. A restaurant that frees up staff hours through self-ordering and multilingual training, and turns tables faster through table-side ordering and a synced kitchen display, is serving more covers with the same footprint and fewer wasted labor hours at the same time. That combination is where most of the real financial return actually shows up, not in any single tool by itself.
Xiang's Hunan Kitchen is a concrete example of what this looks like in practice: switching off a legacy, disconnected system saved the restaurant $15,000 a year — not from one dramatic change, but from removing the redundant subscriptions, commission bleed, and manual reconciliation that come with running several disjointed tools side by side.
Keeping orders on a restaurant's own online ordering system, rather than routing all digital demand through third-party apps, is one of the most direct ways to reduce third party delivery commission — every order placed directly instead of through a delivery app is an order without a 25–30% cut taken off the top. And a restaurant pos with loyalty program capability built on the same purchase data the POS already collects can identify and reward actual repeat customers automatically, instead of running a generic promotion that discounts orders from guests who were already coming back anyway.
A bubble tea chain with five locations offers a different angle on the same principle. Each shop ran its own combination of a regional POS and a separate loyalty punch-card app before consolidating onto one platform. The visible win was administrative — one menu update instead of five, one set of sales reports instead of five separate exports to reconcile by hand at month-end. The less obvious win was that loyalty data finally connected to actual purchase history across all five locations, so a customer who visits three different shops in the chain is recognized as one loyal customer instead of three separate low-frequency guests at three different stores, which changes both how that customer is marketed to and how accurately the business can measure its own retention.
Put real numbers next to the mechanisms above and the return becomes concrete rather than directional. Take a hypothetical full-service hot pot restaurant doing $2 million a year in sales — a realistic size for a single-location operation with a strong weekend business — and walk through where an integrated system's savings actually come from.
Start with labor. Restaurant payroll-cost benchmarks compiled by Toast put the average full-service restaurant at 36.5% of sales in labor cost, against 34.2% for profitable operators specifically. On $2 million in sales, that 2.3-point gap is $46,000 a year. Closing even half of that gap — a realistic outcome from reducing duplicate data entry, matching staffing to actual demand data, and cutting new-hire training time, as described in Chapter 1 — is roughly $23,000 back on the labor line alone, without cutting a single position or a single hour of guest-facing service.
Next, delivery commissions. If this same restaurant does $300,000 a year in third-party delivery volume — a plausible share of total sales for a restaurant with an active delivery presence — a 25–30% commission on that volume is $75,000 to $90,000 paid out annually. Shifting even a third of that volume onto the restaurant's own online ordering channel, where the commission doesn't apply, recovers somewhere between $25,000 and $30,000 a year, simply by giving guests a direct ordering option and a reason to use it, such as a loyalty incentive tied to ordering direct.
Then add software consolidation. A restaurant paying separately for a POS, an online ordering platform, and a loyalty app — a common setup before consolidating — typically spends somewhere in the range of a few hundred to over a thousand dollars a month across all three, depending on transaction volume and feature tier. Even a conservative reduction of $300 to $500 a month from consolidating onto a single platform is $3,600 to $6,000 a year, on top of the labor hours no longer spent reconciling data across systems that don't talk to each other.
These numbers aren't a projection for any single specific restaurant — they're illustrative math built on the national percentages cited above, applied to a realistic revenue scenario. Every restaurant's actual figures will differ based on its real sales mix, delivery dependence, and existing software stack. But the order of magnitude holds directionally: on a $2 million hot pot restaurant, the labor, delivery-commission, and software-consolidation math above adds up to a plausible $50,000 to $60,000 a year in combined recoverable cost. That range sits in the same order of magnitude as Xiang's Hunan Kitchen's real, documented $15,000 annual saving once adjusted down for a smaller restaurant's revenue base — a useful sanity check that the math above isn't inflated marketing arithmetic, but a conservative estimate built on the same structural inefficiencies a real restaurant actually eliminated.
Some owners respond to delivery-commission pressure by trying to negotiate a better rate with a given platform, rather than by building out their own ordering channel. That instinct makes sense on the surface, but it solves a narrower problem than it appears to.
A negotiated rate reduction, even a meaningful one, still leaves the restaurant dependent on a third party for the customer relationship itself. The delivery platform, not the restaurant, controls the guest's app experience, holds the guest's contact information, and decides how prominently the restaurant appears in search results relative to competitors paying for better placement. A lower commission on that arrangement is still a commission on a relationship the restaurant doesn't own.
Building the restaurant's own ordering channel solves a different, larger problem: it gives the restaurant a customer relationship it actually controls, one that can be connected to the same loyalty and purchase-history data described earlier in this chapter, and one that doesn't depend on a platform's algorithm or policy decisions for visibility. The two approaches aren't mutually exclusive — a restaurant can negotiate better delivery-platform terms while simultaneously building direct-channel volume — but treating a rate negotiation as a substitute for owning the direct channel misses the larger and more durable source of savings described throughout this chapter.
Turnover adds a revenue-side return the cost math above doesn't even capture. Recall from Chapter 2 that a hot pot restaurant sitting at the family-style benchmark of roughly three turns across a five-hour dinner service, per Toast's benchmark data, has room to recover wasted minutes within that same ninety-minute-per-turn window rather than compressing the meal itself. Even shaving fifteen minutes of non-eating time off each turn — the minutes lost to a slow second order, a slow expo handoff, or a slow check drop — can be enough to fit in a partial extra turn on a busy night across a full dining room, which is pure incremental revenue on tables and staff hours the restaurant is already paying for.
These figures also lean conservative deliberately. A restaurant currently running closer to the loss-making end of the payroll benchmarks cited above — 42.9% of sales for a full-service restaurant operating at a loss, per Toast's data — has considerably more room to close than the 2.3-point gap used in the example above, meaning the realistic savings for a restaurant further from the profitable benchmark are larger than the numbers above, not smaller. The math above assumes a restaurant that's already reasonably well run and simply carrying the structural inefficiencies described throughout this white paper; a restaurant carrying more inefficiency than that has more to recover, not less.
The hot pot example above isn't the only shape this math takes. A quick-service format like a bubble tea chain sits on a different point of the payroll-cost benchmarks cited by Toast, and the return shows up through a different mix of levers.
Limited-service restaurants, per that same Toast data, run labor cost at roughly 30.0% of sales for profitable operators versus 31.7% across all respondents — a narrower gap than the full-service numbers used in the hot pot example, because counter-service labor is inherently more standardized to begin with. On a single bubble tea location doing $600,000 a year in sales, even that narrower 1.7-point gap is about $10,200 — meaningful for a single unit, and multiplied directly across every location in a small multi-unit chain.
Delivery commissions matter differently here too. A bubble tea shop's per-order ticket size is smaller than a full-service restaurant's, which means a 25–30% commission bites just as hard proportionally but on a smaller absolute number per order — the return from shifting volume to direct ordering comes more from sheer order count than from a few large tickets. A shop doing 3,000 delivery orders a month at a $9 average ticket is paying $6,750 to $8,100 a month in commissions at that range; shifting even 15% of that volume to a direct channel recovers roughly $1,000 to $1,200 a month, or $12,000 to $14,500 a year, per location.
Software consolidation delivers the clearest win for a multi-location bubble tea operator specifically, because the administrative cost of running separate systems multiplies with every additional store. Five locations each paying separately for a POS and a loyalty app, and each requiring its own manual monthly reconciliation, is five times the administrative burden of one location doing the same thing — but consolidating onto one platform doesn't cost five times as much to fix, because the menu, the loyalty program, and the reporting dashboard are shared across every location from a single setup. That's the specific reason multi-unit operators, more than single-location restaurants, tend to see software consolidation as the fastest-payback piece of this math rather than the smallest one.
The math in the previous section is a first-year snapshot, but the return from consolidating systems doesn't stay flat — it tends to grow, for a specific structural reason. A restaurant's own online ordering channel and loyalty program both get more valuable the longer they run, because both depend on accumulated purchase history and repeat-visit patterns that take time to build.
A loyalty program connected to real POS data is worth relatively little in its first few months, when there isn't much purchase history to work from yet. By its second year, the same program has enough data to distinguish a genuinely loyal guest from a one-time visitor, which is when automated, targeted offers start replacing generic discounts, and targeted offers cost less per dollar of repeat revenue generated than blanket promotions do, because they aren't discounting visits that would have happened anyway.
The delivery-commission savings compound differently. Every guest successfully moved from a third-party app to the restaurant's own ordering channel is a guest who has now formed a habit — bookmarking the restaurant's app or site, remembering the direct-order discount, skipping the delivery app step entirely on the next order. That habit, once formed, doesn't need to be re-earned each month the way a delivery app's algorithmic visibility does. The restaurants that see the biggest cumulative commission savings over a three-year period are usually the ones that started shifting guest behavior early, because habit formation has a head start built into it.
Labor savings compound in a third way: once staff are trained on a unified, multilingual system, that training carries forward with every future hire, because the next new employee learns one system instead of learning a POS, then separately learning an online ordering dashboard, then separately learning a delivery-app tablet. The training-time reduction described earlier in this chapter isn't a one-time event tied to a single system switch — it's a permanent reduction in the ramp-up cost calculated in Chapter 1, for every hire the restaurant makes from that point forward.
Everything in this chapter has used single-location math to keep the numbers concrete, but the same framework applies, with one important addition, to a restaurant group running ten or more locations under shared ownership.
The addition is this: at a multi-location group, the cost of running disconnected systems isn't just the sum of each location's individual inefficiency — it's multiplied by the loss of any cross-location visibility. An owner running eight restaurants on eight separate, unconnected instances of the same basic setup can't easily compare performance across locations, can't move inventory or staffing insight from a well-run location to a struggling one, and can't run one loyalty program that recognizes a guest who visits two different locations in the same week as the same customer. Each of those gaps is a multiple of the single-location cost described earlier in this chapter, not an additive extra.
That also means the ROI math scales favorably for larger groups in a way it doesn't for a single restaurant. The software-consolidation savings described earlier in this chapter grow roughly linearly with location count, but the value of cross-location reporting, standardized training, and a shared loyalty program grows faster than linearly, because comparing ten locations against each other is itself a distinct benefit a single-location owner never has access to at all. For an owner-operator planning to grow from a handful of locations toward ten or more, the case for consolidating onto one system early is stronger, not weaker, than it is for a single, established restaurant — because every location added on a disconnected foundation adds to the eventual cost of fixing it later, per the same logic described in the cost-of-doing-nothing discussion earlier in this chapter.
Before trusting any projected savings number, check it against how the restaurant actually operates.
Does the projected saving assume replacing the whole stack, or just adding one more system on top of what's already there? A tool that still requires the old POS, the old online ordering platform, or the old loyalty app to keep running in parallel won't deliver anywhere close to its advertised return, because the restaurant is still paying for — and manually reconciling — everything it was paying for before.
Is the ROI figure based on a generic national restaurant benchmark, or does it reflect how an Asian restaurant actually operates — multi-round ordering, bilingual staffing, larger group tables, AYCE or hot pot pricing? A savings estimate built on a typical American fast-casual concept will usually understate what a hot pot or AYCE restaurant can actually save, because those formats carry more of the exact inefficiencies — duplicate entry, slow turnover, uncoordinated loyalty — that an integrated platform removes.
What does the full switching cost look like, not just the subscription price comparison? Staff retraining time, menu re-entry, and hardware setup are real costs on the way in. The restaurants that see the fastest payback are usually the ones that treat the switch itself as a short, planned project rather than something to squeeze in during a busy week.
Does the number hold up a year from now, or only in the first few months after switching? Some of the return from consolidating systems is a one-time cleanup — canceling redundant subscriptions, for instance — but the larger, more durable return comes from labor and turnover gains that compound month over month as staff get fully trained on the new system and the restaurant's own ordering channel builds momentum against third-party delivery apps. Ask specifically which part of a projected number is a one-time gain and which part is meant to repeat every year, because conflating the two overstates the ongoing return.
Beyond the ROI math, a handful of practical questions determine whether a switch goes smoothly or turns into the exact kind of disruption an owner was trying to avoid by staying on the old system in the first place.
Who owns the customer and sales data once it's in the new system, and can it be exported in full if the restaurant ever needs to leave? A platform that makes data easy to bring in but difficult to take out is optimizing for lock-in, not for the restaurant's long-term flexibility, and confirming this before signing is the kind of detail that's easy to skip under time pressure.
What does onboarding actually look like during the first two weeks — is there a real person walking staff through the new system in the language they need it in, or a generic video library and a support ticket queue? The training-time savings described in Chapter 1 only materialize if the transition itself doesn't recreate the same training burden it's meant to eliminate.
What happens on the specific night something goes wrong? Every system fails occasionally — a network hiccup, a printer that won't connect, a kitchen display that freezes mid-rush. The restaurants least disrupted by these moments are the ones who confirmed, before switching, exactly how fast support responds during peak hours and whether that support is available in the language the manager on duty is most comfortable troubleshooting in.
These questions rarely show up in a standard ROI spreadsheet, but they determine whether the ROI in that spreadsheet ever actually materializes. A restaurant that gets the math right but the transition wrong ends up back where this chapter started — paying for more than it needs, and reconciling more than it should have to.
Labor efficiency, faster turns, and lower technology overhead aren't three separate initiatives competing for an owner's attention — they're three views of the same underlying problem: running one connected system instead of several disconnected ones. The next section turns that into something an owner can actually act on over the next ninety days.
Everything in this white paper comes back to one pattern: the restaurants losing the most money to inefficiency aren't necessarily working harder or hiring worse — they're running more disconnected tools than their format can afford. A hot pot restaurant staffing a weekend rush, an AYCE concept trying to turn tables without rushing guests, and an owner reconciling four different subscription bills every month are all facing the same root cause from three different angles.
The fixes in this white paper don't require ripping out every system at once and closing for a week to do it. They work better as a sequence, with each phase building on the one before it. What follows is a week-by-week breakdown of the same ninety days, organized into three thirty-day phases.
The highest-value work in the first month is diagnostic, not operational — and it pays to resist the urge to start fixing things before the diagnosis is complete, because the biggest bottleneck is rarely the one an owner assumes it is walking in.
In week 1, track exactly where staff hours go during one full, representative week — a slow weekday, a mid-week evening, and a full weekend. Note every instance of a manager or server doing manual data entry: re-keying a menu change, keying an order taken verbally, reconciling a delivery app's numbers against the POS by hand. This doesn't need special software; a simple tally kept at the host stand or by the manager on shift is enough to start seeing the pattern.
In week 2, shift the same tracking exercise to the guest side of the business. Time how long it actually takes, table by table, from a guest signaling they're ready for a second round to a server reaching them, and from a check being requested to the table actually being cleared. Identify the single point where that cycle stalls most consistently — for most Asian restaurants running multi-round service, per the mechanics described in Chapter 2, this is the point where a guest is ready to order again but every server is occupied elsewhere.
In weeks 3 and 4, add up every software subscription, every delivery app commission paid over the past three months, and every hardware cost tied to running separate systems. Most owners are surprised by at least one number in that audit — usually either the total delivery commission paid over a quarter, or the total monthly software spend once every small recurring charge is added up in one place rather than reviewed separately each month. Close out the month by ranking the three findings — the labor pattern, the turnover bottleneck, and the total systems cost — by which one is costing the most in real dollars, because that ranking determines where month two starts.
The second month is about acting on the single biggest finding from the audit, rather than attempting every fix from this white paper simultaneously, which tends to overwhelm both staff and the restaurant's ability to actually measure what worked.
In week 5, if labor was the biggest finding, introduce the specific fix identified in Chapter 1 — self-ordering kiosks during peak hours, table-side QR ordering for multi-round service, or a multilingual interface rollout for new hires — starting during the restaurant's lower-volume shifts first. If turnover was the biggest finding instead, this is the week to connect the kitchen display system directly to the ordering platform rather than continuing to route tickets through a printer a runner has to sort manually.
In week 6, extend whatever change started in week 5 to the restaurant's highest-volume shift — typically Friday or Saturday dinner — and have a manager physically present to catch and correct any workflow issues in real time rather than discovering them from a customer complaint after the fact. This is also the week to retrain staff specifically on whatever changed, ideally in the language they're most comfortable working in, so the transition doesn't create a second labor problem while solving the first one.
In weeks 7 and 8, address the second-ranked finding from the initial audit. If the first month's biggest issue was labor and it's now been addressed, this is the point to connect the loyalty program to real purchase data instead of running it as a disconnected app, or to start actively steering guests toward the restaurant's own online ordering channel instead of a third-party delivery app for at least a portion of digital orders. By the end of week 8, at least two of the three findings from the initial audit should have a specific, implemented fix running in production, not just planned.
The final month is about measurement and consolidation rather than introducing anything new, because a restaurant that never stops changing things can never isolate which specific change actually produced a result.
In week 9, repeat the exact same tracking exercise from week 1 and week 2 — staff hours by task, and table-cycle timing at the same bottleneck point identified originally — using the same methodology, so the comparison is apples to apples rather than a rough before-and-after impression.
In week 10, compare the results directly against the first month's baseline: covers per shift, labor hours against the same sales volume, and the share of digital orders coming through the restaurant's own channel versus a third-party app with a commission attached. This comparison is what turns the ninety days from a set of operational changes into a documented return an owner can point to — in a conversation with a business partner, a lender, or simply in deciding what to prioritize next.
In weeks 11 and 12, address whatever finding from the original audit hasn't been tackled yet, using the same sequence — implement, retrain, extend to peak hours, measure — that worked in the previous sixty days. Close the ninety days by setting the next quarter's single biggest priority based on what the data actually shows now, rather than what seemed most urgent ninety days ago, because the restaurant's real bottleneck often shifts once the first and second problems are actually solved.
A few mistakes show up often enough across restaurants running this kind of plan that naming them here is more useful than discovering them the hard way.
The first is skipping the diagnostic month because the biggest problem feels obvious already. It rarely is. An owner convinced the issue is labor cost is sometimes looking at a turnover problem in disguise — a kitchen running behind because of ticket-routing chaos looks, from the front of house, exactly like a restaurant that's short-staffed, even when the real fix has nothing to do with headcount.
The second is changing too much at once during month two. Rolling out table-side ordering, a new kitchen display, and a loyalty program overhaul in the same week makes it nearly impossible to tell which change produced which result by month three, and it multiplies the amount of retraining staff have to absorb simultaneously, which risks the exact labor disruption this plan is meant to prevent.
The third is stopping the measurement at day ninety instead of carrying it forward. The ninety-day plan is a first cycle, not a finish line, and the restaurants that keep tracking the same numbers — covers per shift, labor cost as a share of sales, share of direct versus third-party digital orders — well past day ninety are the ones who catch it early when an old habit starts creeping back in, rather than discovering a year later that the gains quietly disappeared.
By the end of the ninety days, a restaurant that followed this sequence should be able to answer three concrete questions with real numbers instead of impressions: how many covers per shift is the restaurant serving now compared to day one, how does labor cost as a share of sales compare to the baseline audit from the first month, and what share of digital orders is now coming through the restaurant's own channel instead of a third-party app charging a 25–30% commission on every one of them.
A dramatic swing across all three numbers isn't the bar for success at day ninety. A few extra covers per shift, two or three points of labor cost recovered, and a meaningfully larger share of direct orders are realistic, durable outcomes — and because the fixes in this white paper compound over time, as described in Chapter 3, day ninety is closer to the starting point of the real return than the end of it. The restaurants that treat this as a one-time project rather than the first cycle of an ongoing practice are the ones that see the gains fade within a year, once the initial changes stop being actively managed and the old habits — instinct-based scheduling, uncoordinated systems, unmanaged delivery dependence — quietly creep back in.
By Chowbus's own market analysis, the Asian restaurant sector has grown 135% over the past 25 years and is on pace to reach $240 billion by the end of 2026. The restaurants capturing the most of that growth aren't necessarily the ones with the biggest marketing budgets — they're the ones whose operations can actually keep up with demand without burning out their staff or their margins in the process. Chowbus, which serves more than 9,000 restaurants across all 50 U.S. states with 24/7 bilingual support in English, Chinese, and Spanish, built its platform specifically around the labor, turnover, and integration problems this white paper describes, because they're the same three problems its own customer base has been solving one restaurant at a time since 2016.
The tools to close the efficiency gap described in this white paper already exist, and none of them require a restaurant to shut down to install them. What's usually missing is the ninety days it takes to put them in place, in the order this conclusion lays out — diagnose first, fix the biggest problem first, and measure before declaring victory — rather than trying to fix everything at once and losing track of what actually worked.
Q1: What does restaurant operational efficiency actually mean for an Asian restaurant?
It comes down to three specific things: reducing the labor spent on tasks a system should handle, cutting the time between a guest sitting down and a table turning over that has nothing to do with eating, and lowering the hidden cost of running several disconnected systems. Each one helps on its own, and they compound when addressed together, which is why this white paper treats them as one connected problem rather than three separate initiatives.
Q2: How much does switching to an integrated restaurant POS system typically cost, and how fast does it pay back?
The real cost includes more than the subscription price difference — staff retraining, menu re-entry, and hardware setup are all part of switching. Xiang's Hunan Kitchen saved $15,000 a year after moving off a legacy, disconnected system. Payback speed depends on how many separate tools a restaurant is currently running and how much of its volume goes through third-party delivery apps, since commission savings tend to show up fastest.
Q3: Where should a busy owner start if they can't shut down to overhaul everything at once?
Start with a 30-day audit rather than an operational overhaul: track where staff hours actually go during a normal week, identify the single busiest ordering bottleneck, and add up every software subscription and delivery commission being paid. The next 30 days focus on fixing the single biggest friction point identified, and the final 30 days are for measuring covers per shift, labor hours, and the share of orders coming through the restaurant’s own channel. None of it requires closing to execute.