2026 North American Asian Restaurant Industry Digital Operation White Paper
2026 North American Asian Restaurant Industry Digital Operation White Paper
— In-depth Case Analysis and Trend Insights Based on POS Integration, Self-service Ordering, and AI Marketing
Chapter 1: Executive Summary
1.1 Industry Background
In recent years, the North American restaurant industry has undergone significant transformation, with Asian Cuisine becoming one of the fastest-growing market segments. Especially in cities like Los Angeles, New York, Toronto, and Vancouver, the number of Asian restaurant outlets continues to increase, showing a trend of diversification and rapid expansion.
Major factors driving this growth include:
Demographic Changes: The North American Asian population continues to increase. According to the U.S. Census Bureau’s 2024 Census Brief, the compound annual growth rate of the North American Asian population exceeded 30% between 2010 and 2024, becoming the fastest-growing ethnic group in the nation, directly driving demand for Asian cuisine consumption.
Social Media Influence: Short-video platforms (e.g., TikTok, Instagram) and restaurant review platforms (e.g., Yelp) have caused Asian restaurant culture to be widely disseminated. Young consumer groups, in particular, have significantly increased their attention on "viral" restaurants and specialty dishes.
Parallel Development of Delivery and Dine-in: The popularization of delivery platforms like Uber Eats and DoorDash has given Asian cuisine higher market penetration in fast-casual and quick-service models.
Evolution of Consumer Behavior: With the popularization of mobile interaction and contactless payments, consumers prefer online ordering, mobile payments, intelligent recommendations, and member loyalty point systems. This requires restaurants to adapt quickly to digital operations.
Sources: U.S. Census Bureau (2021); Additional analysis by Pew Research Center (2021).
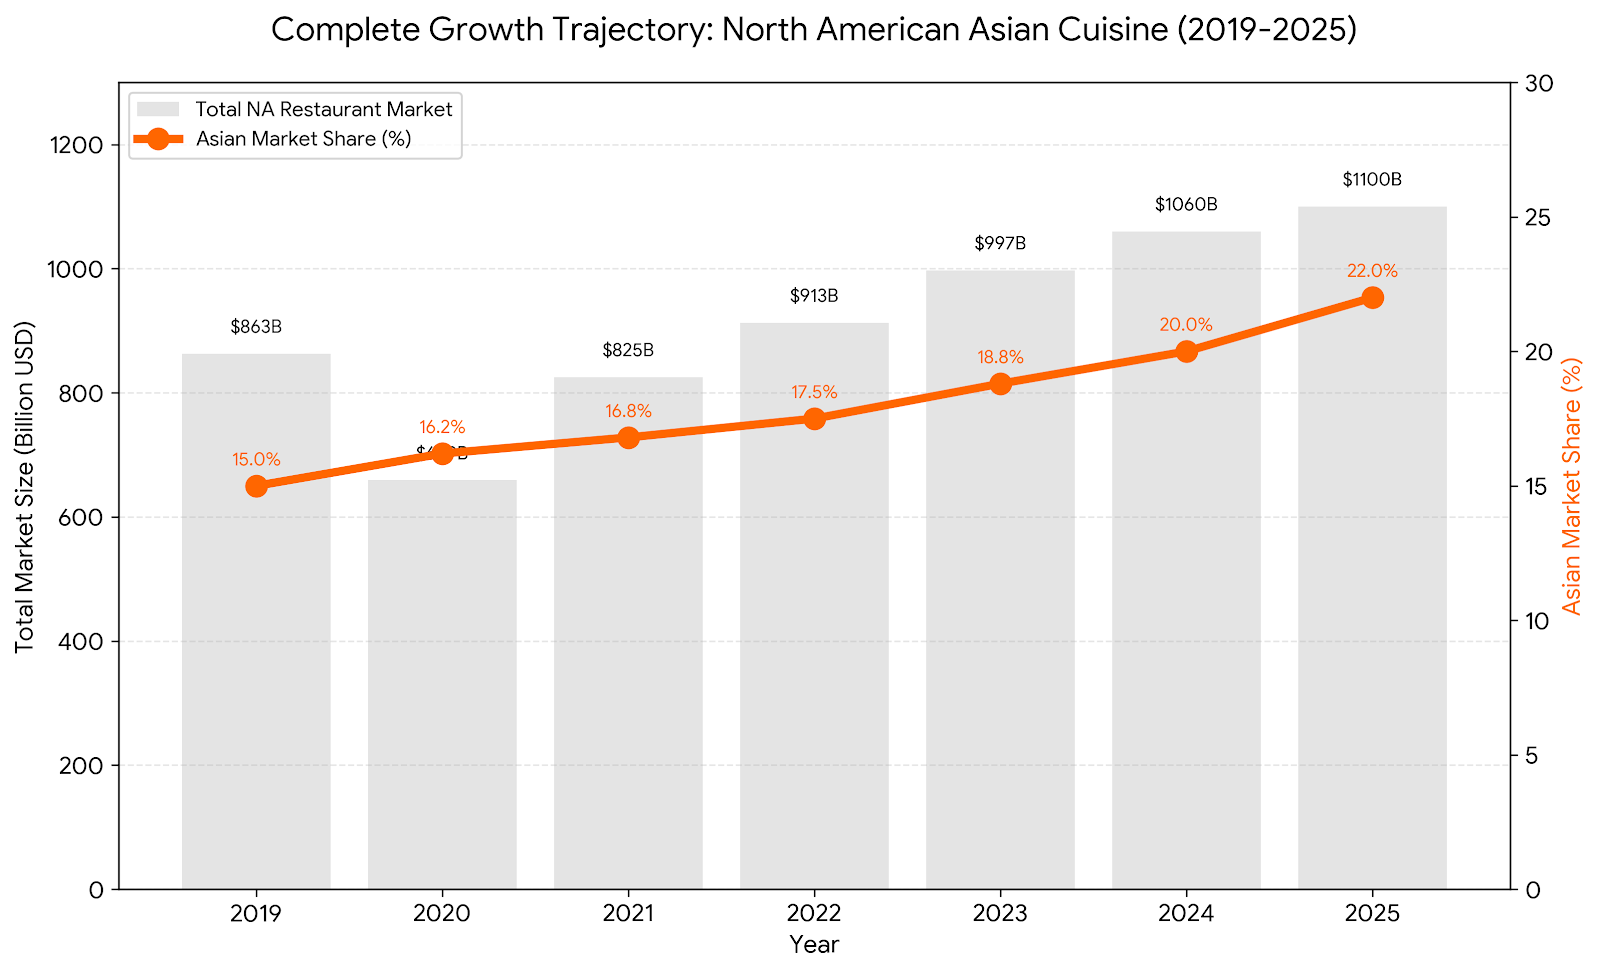
1.2 Market Size and Growth Trends
According to the National Restaurant Association (NRA) 2025-2026 State of the Restaurant Industry Report and industry tracking data:
The Compound Annual Growth Rate (CAGR) of Asian cuisine is approximately 6–8%, far higher than the overall restaurant industry growth rate of 3–4%. In major cities, high-end restaurants and fast-casual models coexist to meet the needs of different consumer groups.
Source:National Restaurant Association (NRA). State of the Restaurant Industry Report 2025 & 2026. (Data confirms Asian cuisine as a top-growth segment with Southeast Asian flavors leading consumer interest).
1.3 Consumer Behavior and Digital Trends
The dining behavior of modern consumers is becoming digital:
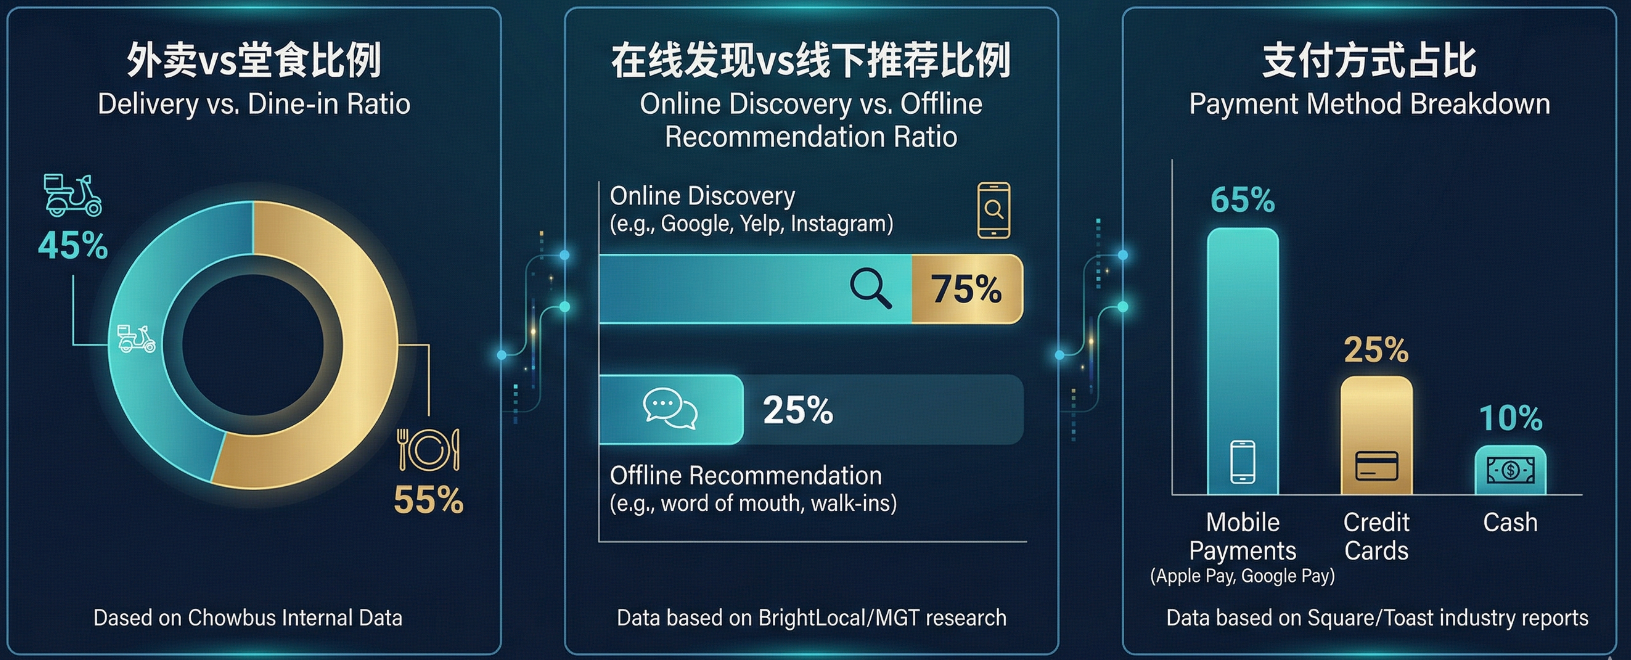
Online Restaurant Discovery: Over 77% of customers use Google Search before deciding which restaurant to visit. Among Gen Z, 67% discover new restaurants through TikTok and Instagram.
Parallel Delivery and Dine-in: Research shows that approximately 40–50% of North American Asian restaurant orders are completed through delivery platforms.
Review-Driven Choices: A ReviewTrackers survey shows that 90% of consumers consult online reviews before choosing a restaurant.
Digitized Payment Methods: Usage of mobile payments (Apple Pay, Google Pay, credit cards) exceeds 65%, while cash usage has dropped below 10%.
The North American Asian restaurant market is expanding rapidly, and the introduction of digital technology is key to enhancing restaurant competitiveness. The Executive Summary emphasizes:
Asian restaurant market growth is strong, and digital consumption trends are evident.
POS, integrated systems, self-service ordering, AI marketing, and data analysis are key technologies.
Chapter 2: North American Asian Restaurant Market Overview
2.1 Overall Scale of the North American Restaurant Industry
The North American restaurant industry is one of the world's largest consumer markets, with steady overall market size growth from 2019 to 2024. According to National Restaurant Association (NRA) data, regional Asian specialties are seeing a 6-8% CAGR.
Source:Datassential. Asian Food Trends 2025: The Evolution Toward Culinary Authenticity. (Highlighting a 6-8% CAGR for regional Asian specialties).
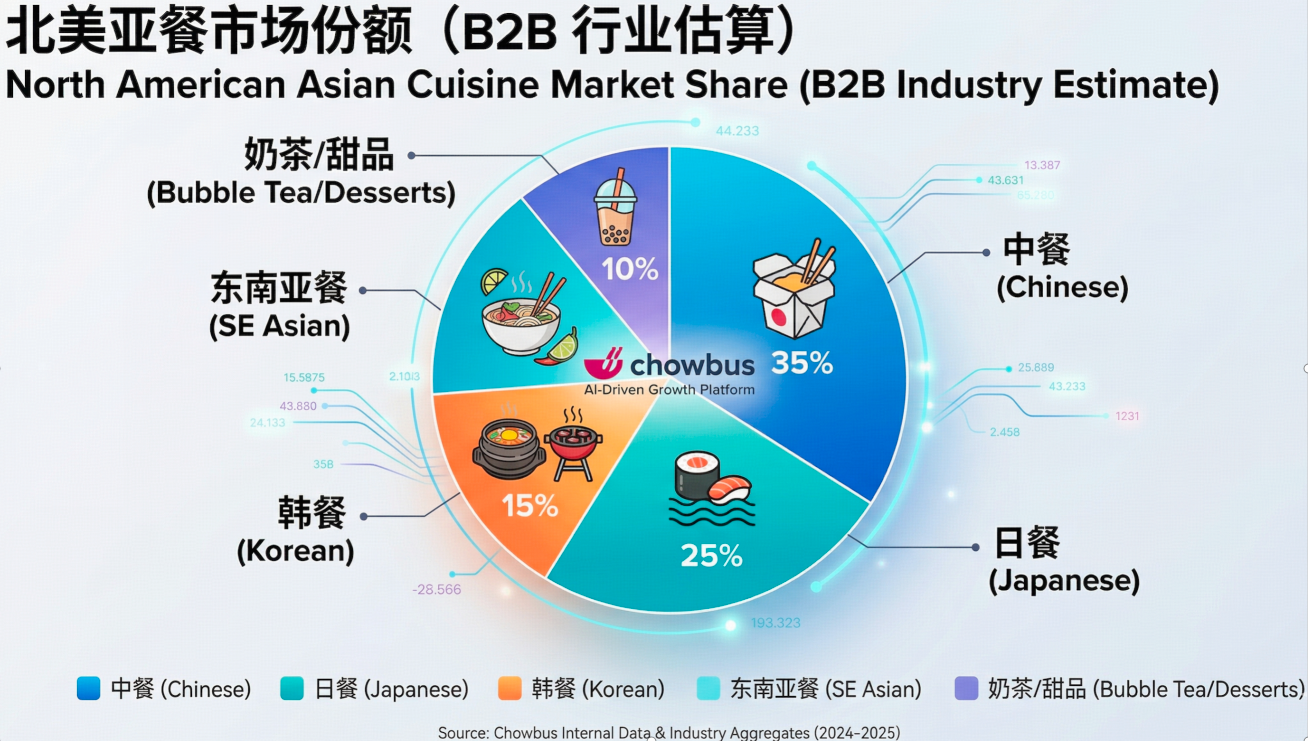
2.2 Asian Restaurant Market Segmentation
The Asian restaurant market can be segmented by cuisine type:
Chinese: 35% market share. Primarily full-service dining, suitable for family consumption, with a high proportion of delivery orders.
Japanese: 25% market share. Fast-casual format, with sushi and ramen at the core, catering to both high-end dining and delivery.
Korean: 15% market share. Younger consumer groups prefer fast-food chains and socialized consumption.
Southeast Asian: 15% market share. Focuses on niche innovative flavors and social media dissemination.
Bubble Tea/Desserts: 10% market share. High consumption frequency and low unit price, but stable customer flow.
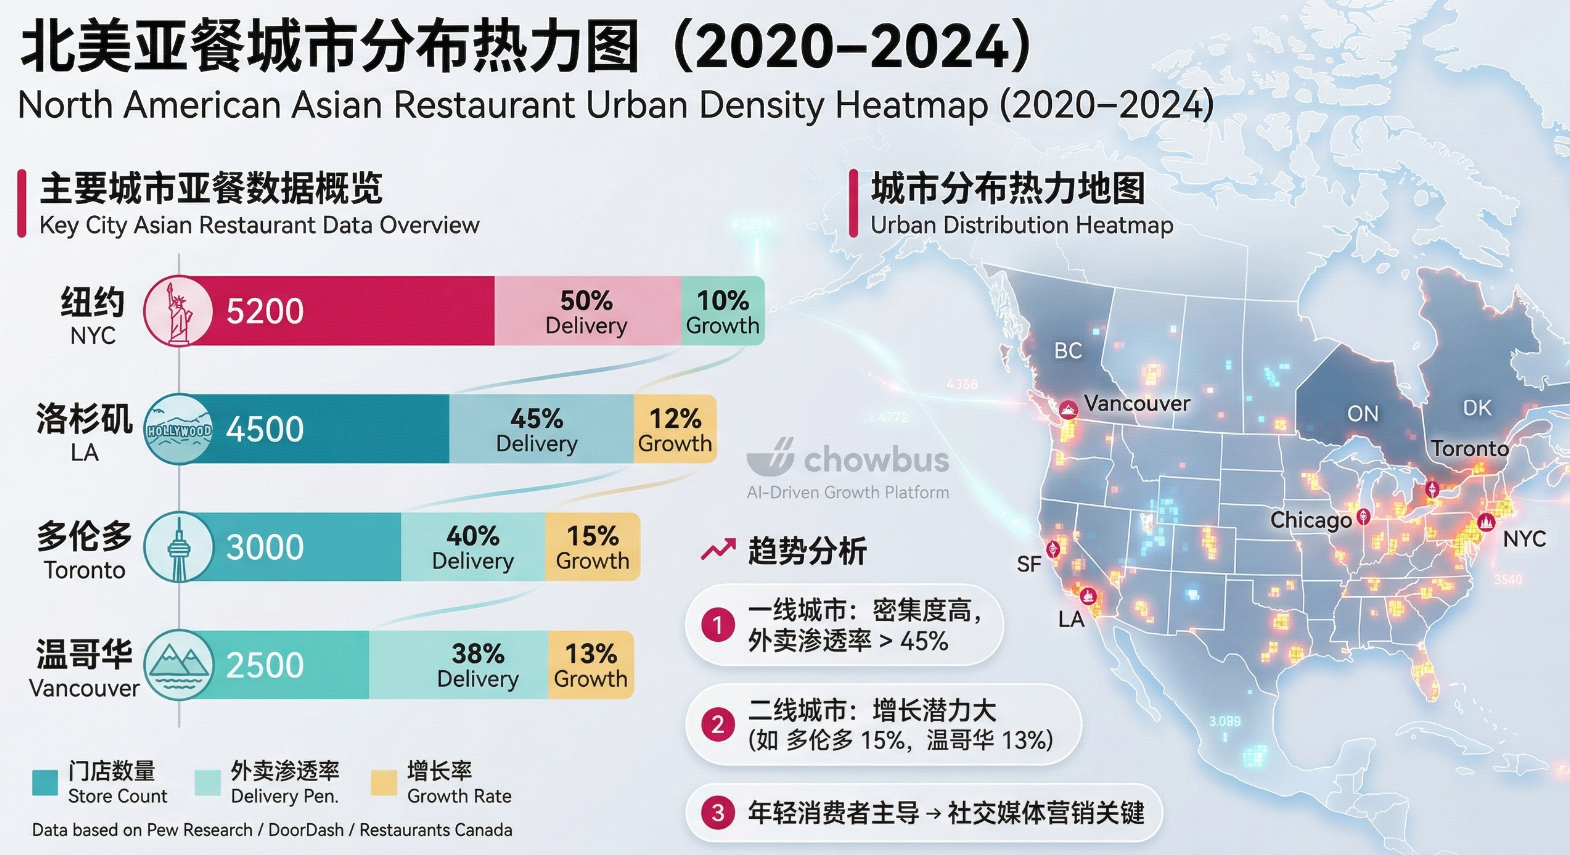
2.3 Regional Distribution
North American Asian restaurants are concentrated in metropolitan areas and university towns:
New York (NYC): 5,200 stores; 50% Delivery penetration; 10% Growth.
Los Angeles (LA): 4,500 stores; 45% Delivery penetration; 12% Growth.
Source:Pew Research Center (2023) mapping of Asian culinary hubs, combined with DoorDash Merchant Insights and Restaurants Canada 2024 Annual Reports. Figures represent estimated counts within Greater Metropolitan Areas (MSAs)
Trend Analysis:
Tier 1 cities have high store density and high delivery penetration.
Tier 2 cities have large growth potential and are dominated by young consumers.
Social media marketing is particularly important in large cities.
Sources: Pew Research Center (2023); DoorDash Merchant Insights; Restaurants Canada 2024 Annual Reports.
2.4 Consumer Group Analysis
Asian restaurant consumers are primarily young people and middle-class families:
Age Structure: 18–34 years old (45%); 35–50 years old (35%); 50+ years old (20%).
Income Level: Primarily an annual income of $50,000–$120,000.
Preferences: Value quality, convenience, and digital ordering experiences.
Consumption Behavior: High proportion of fast-casual and delivery; dine-in focuses more on experience.
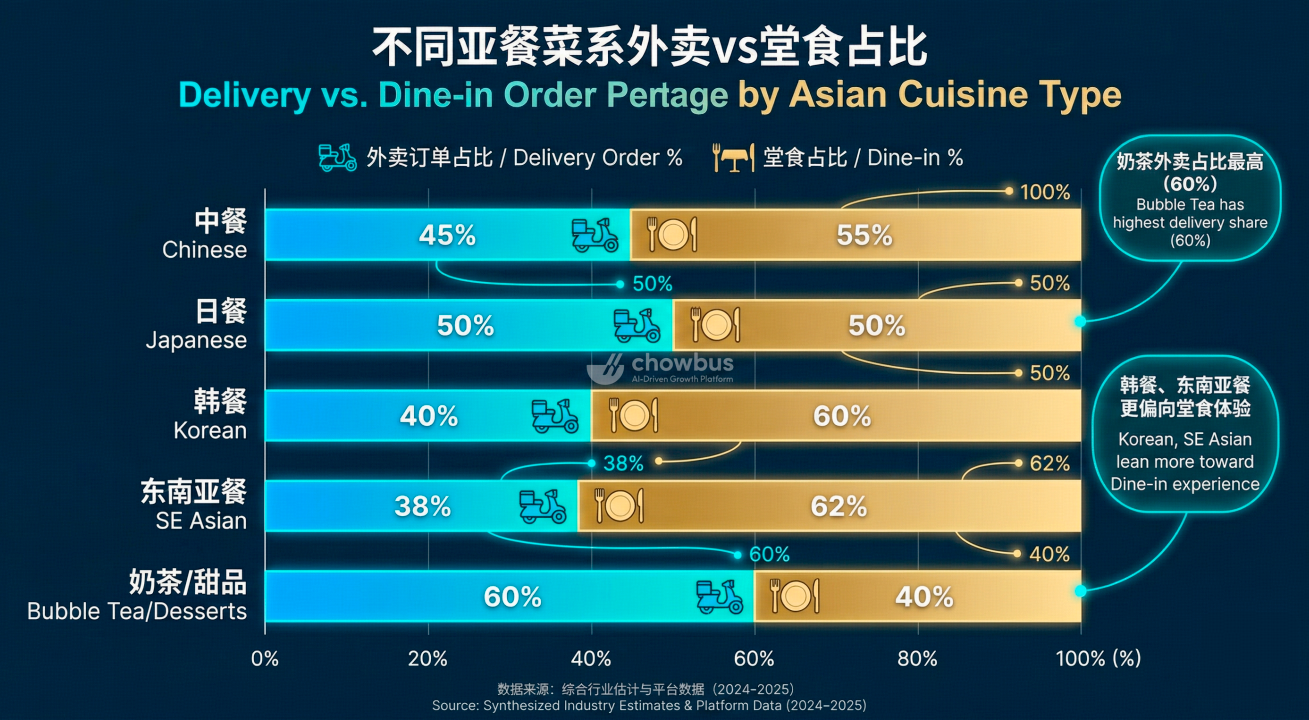
2.5 Delivery vs. Dine-in Proportions
The contribution of delivery platforms to Asian restaurant growth is evident, with Bubble Tea having the highest delivery share at 60%.
2.6 Market Trend Analysis
Growth Drivers: Demographic changes + digital consumption trends.
Tech-Driven: Integrated POS, self-service ordering, and AI marketing are key.
Operational Optimization Needs: Multi-channel order management, inventory management, and marketing data analysis have become essential.
2.7 Strategic Recommendations
Store Expansion Strategy: Choose Tier 1 cities with high delivery penetration while monitoring market potential in Tier 2 cities.
Cuisine Layout Optimization: Adjust menus according to regional preferences and integrate with social media hotspots.
Digital Operations: Deploy integrated POS systems and self-service ordering in advance to improve efficiency.
Data-Driven Decision Making: Use delivery, membership, and social data to guide site selection and marketing placement.
Chapter 3: Consumer Behavior and Market Trends
3.1 Digital Consumption Trends
The behavior of North American Asian restaurant consumers is rapidly digitizing. According to a ReviewTrackers 2023 survey, approximately 90% of consumers consult online reviews before choosing a restaurant, and 65% of consumers prioritize restaurants that support online ordering and mobile payments.
Main Characteristics:
Online Restaurant Discovery: Google Search, Yelp, Instagram, and TikTok are the primary channels. Social media short videos play a key role in exposing new restaurants. Consumers check photos, videos, and reviews on social platforms to judge restaurant quality.
Rising Delivery Order Proportions: Delivery platforms (Uber Eats, DoorDash, Grubhub) account for 40–50% of total orders. Peak hours are 11:30–13:30 for lunch and 18:00–20:00 for dinner.
Digitalized Payment Methods: Mobile payments (Apple Pay, Google Pay) account for 35%; credit/debit cards account for 30%; cash accounts for only 10–15%. Digital payments combined with member loyalty point systems increase repeat purchase rates.
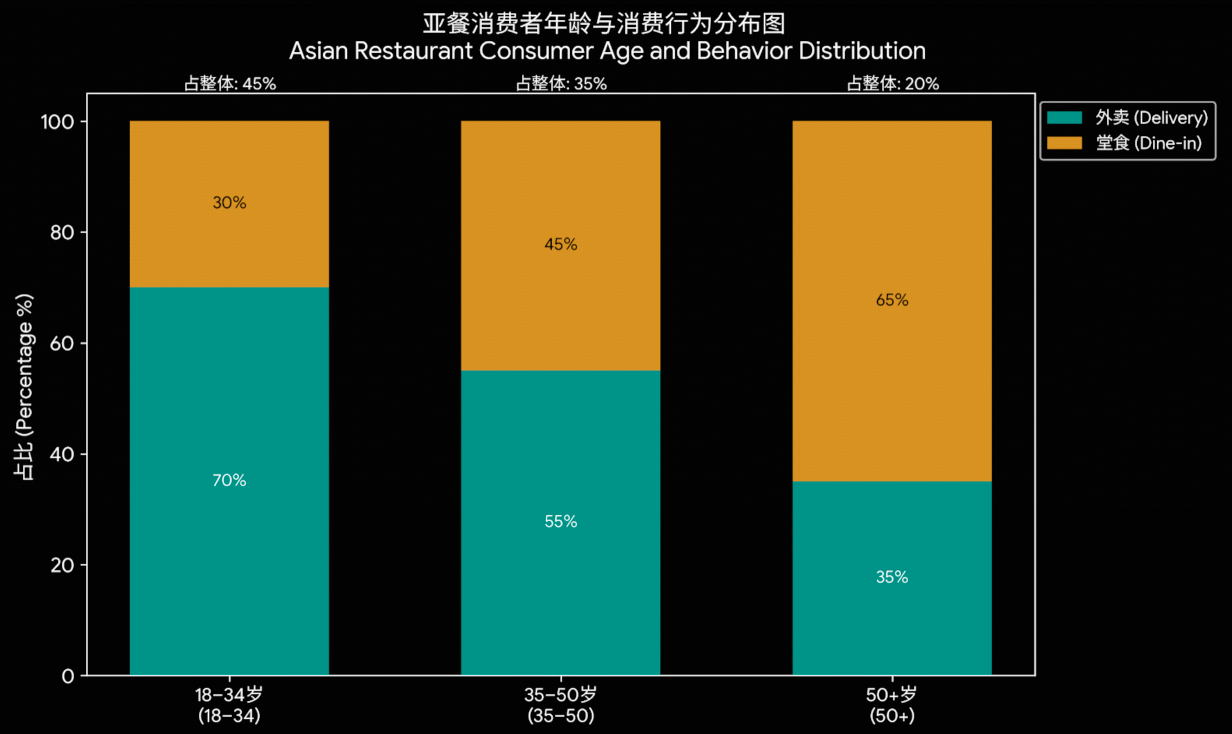
3.2 Consumer Persona Analysis
North American Asian restaurant consumers are primarily young people and middle-class families.
18–34 years old: Represents 45% of total; 70% delivery, 30% dine-in.
35–50 years old: Represents 35% of total; 55% delivery, 45% dine-in.
50+ years old: Represents 20% of total; 35% delivery, 65% dine-in.
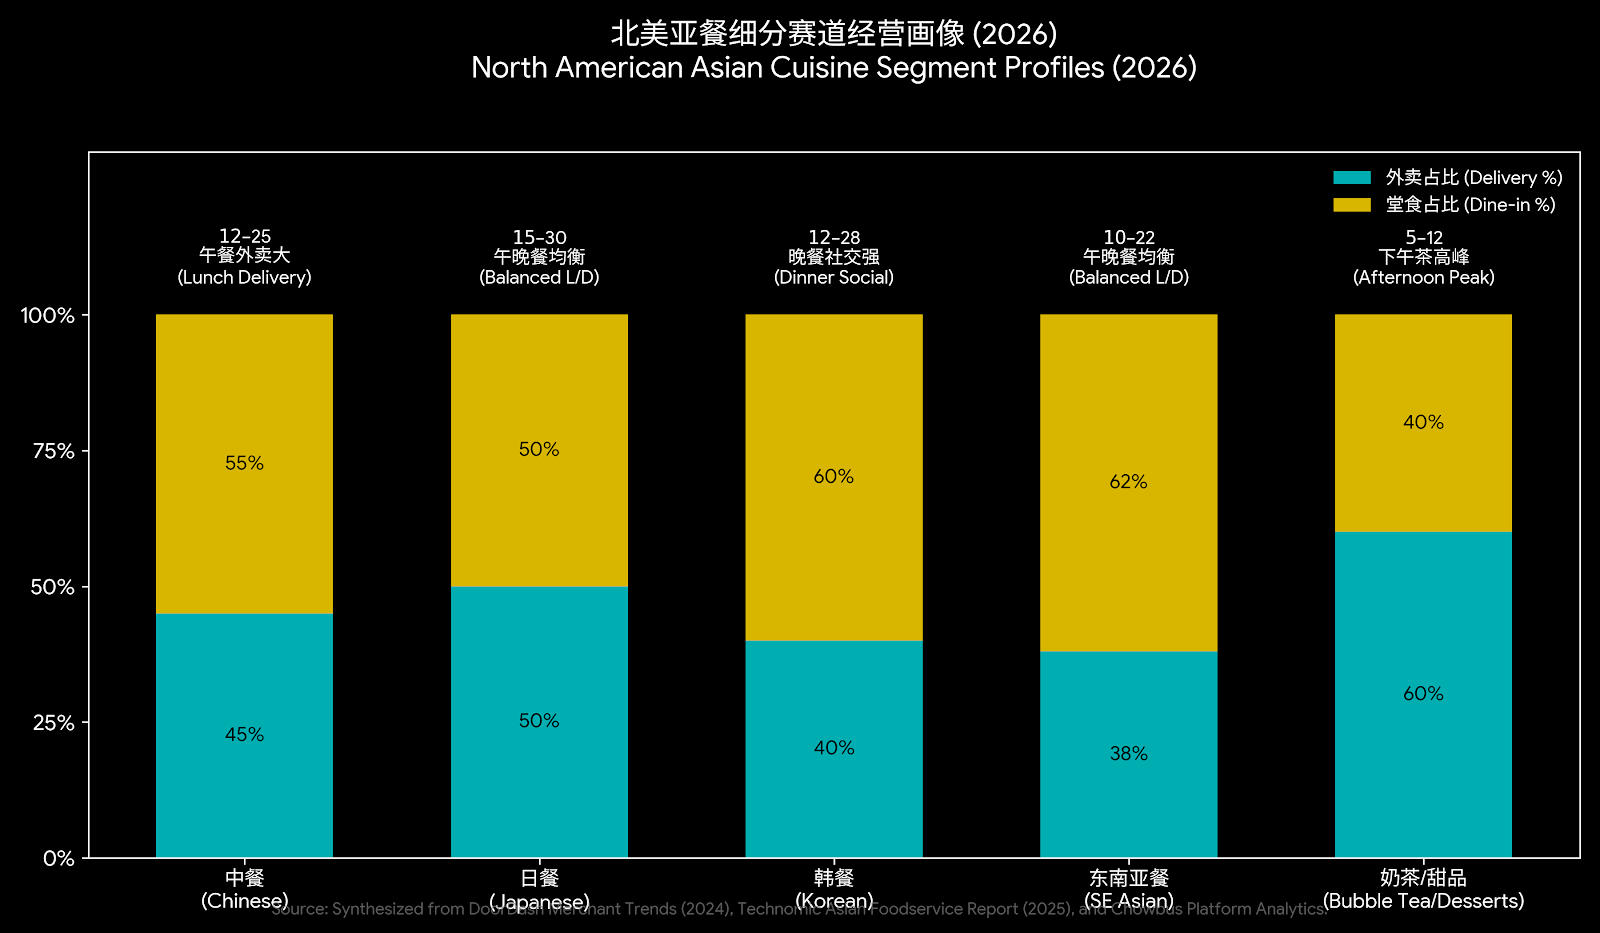
3.3 Cuisine Preferences and Ordering Behavior
Consumption behavior varies across different Asian cuisine types:
Source: Synthesized from DoorDash Merchant Trends (2024), Technomic Asian Foodservice Report (2025), and Chowbus Internal Platform Analytics.
Insight:
Cuisines with high delivery proportions, such as bubble tea/desserts, are suitable for fast delivery.
Cuisines with high dine-in proportions, such as Korean and SE Asian, need to focus on the dining experience.
Menu design and set meal pairings should be optimized based on differing average check prices.
3.4 Consumer Decision Factors
Restaurants attracting consumers need to focus on several factors (Source: Yelp & Statista 2023):
Online Reviews: Ratings >4.0 can increase delivery volume by an average of 20%. Keywords like "fast, accurate, good taste" account for 60% of review content.
Delivery and Service Speed: Average delivery time <30 minutes can significantly improve repeat purchase rates.
Menu Visualization and Recommendations: Displaying menu items with images/videos can increase the average check by 8–15%. AI mechanisms can provide personalized recommendations based on order history.
Discounts and Loyalty Systems: Coupons and points improve customer loyalty. Member promotions can increase average repeat purchase rates by 10–15%.
3.5 Social Media and User Generated Content (UGC) Influence
Social media and UGC are crucial for promoting Asian restaurants in North America:
Popular videos on TikTok and Instagram can bring 15–25% new customer growth.
Instagram Stories and Reels have the greatest impact on young consumers.
User reviews and photo sharing (UGC) significantly improve brand exposure.
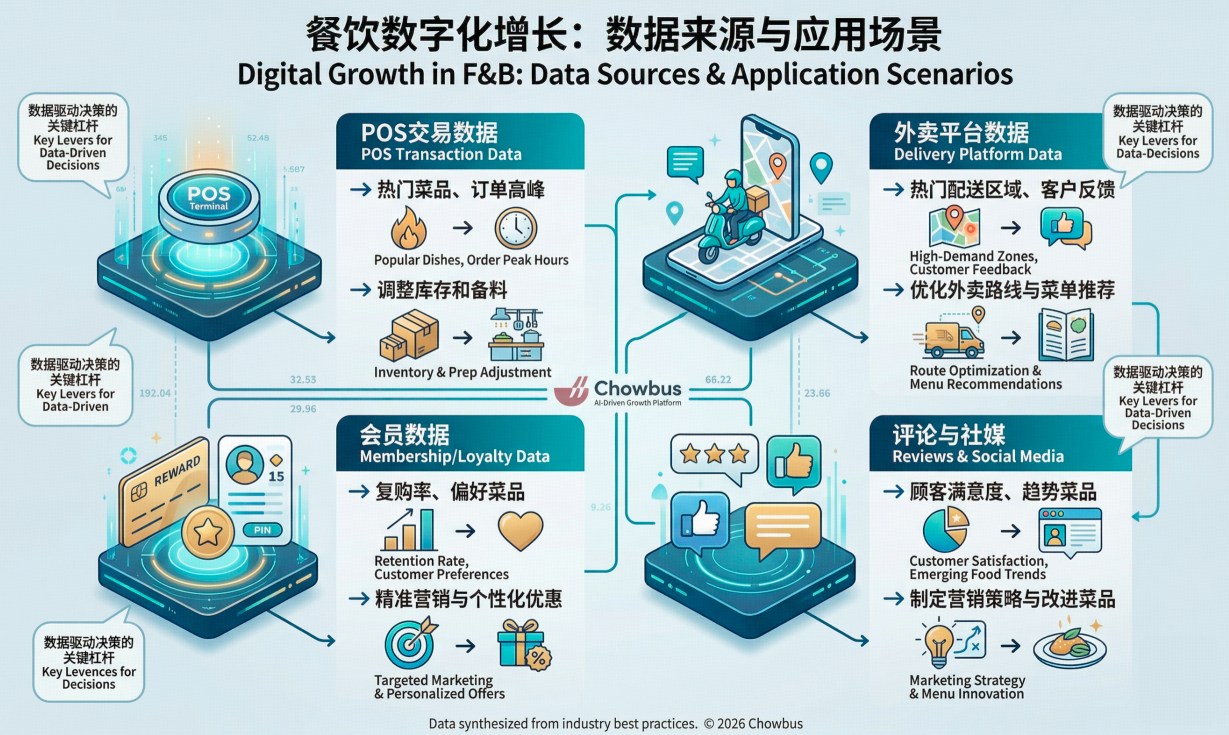
3.6 Consumer Behavior Data Analysis Framework
For data-driven operations, restaurants should focus on these data types:
POS Transaction Data: Popular dishes, order peaks; used for adjusting inventory and prep.
Delivery Platform Data: Hot delivery zones, customer feedback; used for optimizing routes and menu recommendations.
Member Data: Repeat purchase rates, preferred dishes; used for precision marketing and personalized offers.
Reviews and Social Media: Customer satisfaction, trending dishes; used for formulating marketing and improving dishes.
3.7 Insights from Consumer Behavior for Operations and Marketing
Digitized Ordering and Payment are key to increasing efficiency and satisfaction.
Peak Hour Order Management requires automation, such as integrating self-service and POS.
Social Media Marketing and UGC directly drive new customer growth.
Data-Driven Strategies can precisely predict demand and optimize inventory/marketing.
Chapter 4: Integrated POS System Analysis
4.1 POS System Development Background
POS (Point of Sale) has evolved from basic cashier functions to a core management platform for operations. Traditional manual methods no longer meet modern requirements for multi-channel management and inventory complexity.
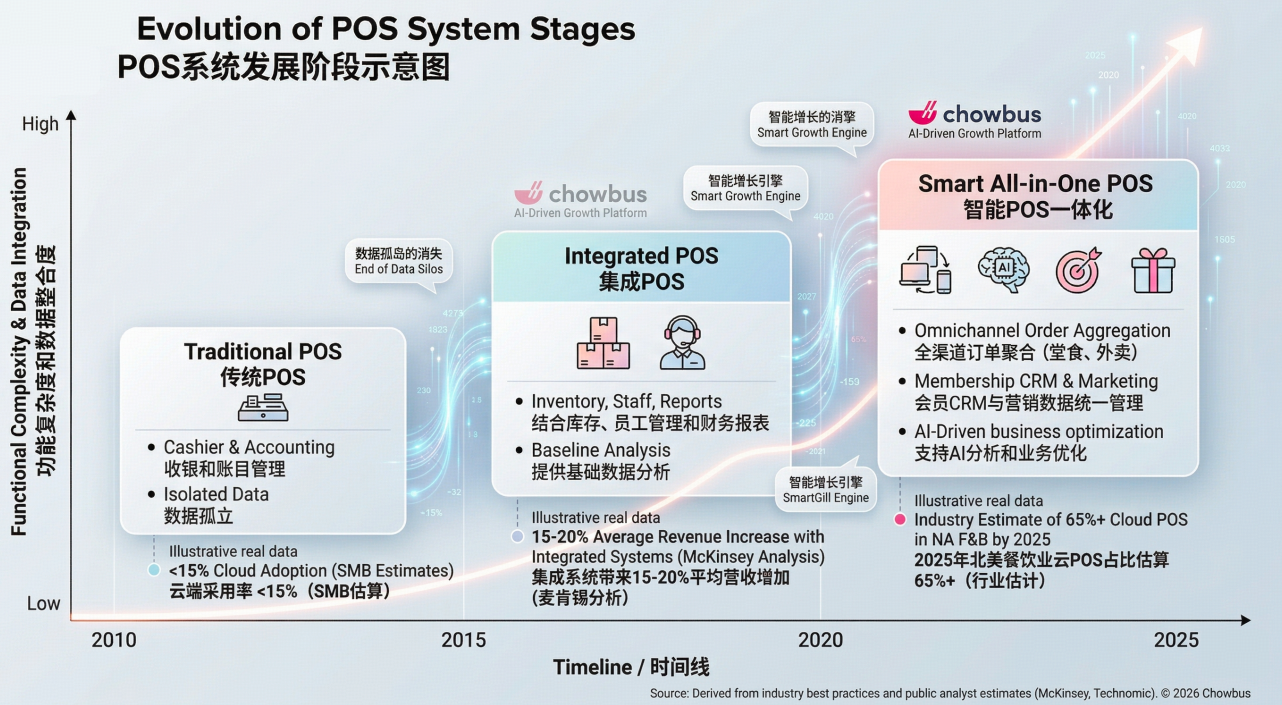
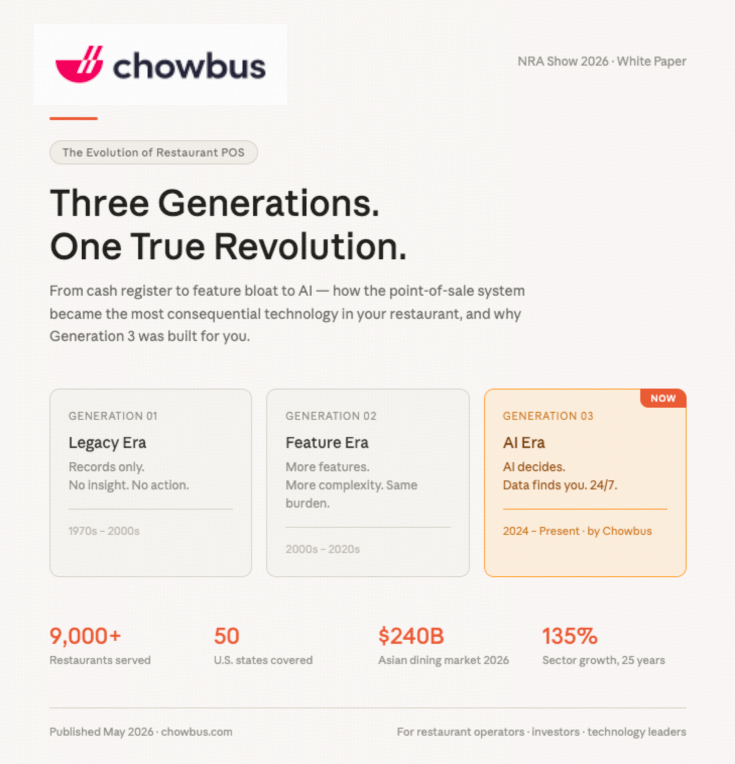
Development Stages:
Traditional POS: Primarily for cashiering/accounting; single function, isolated data.
Integrated POS: Combines inventory, staff management, and financial reports; provides basic data analysis.
Smart All-in-One POS: Unified management of dine-in, delivery, inventory, members, and marketing; supports AI analysis and business optimization.
4.2 Integrated POS System Core Functions
4.2.1 Order Management: Unified management of dine-in, delivery, and third-party orders. Real-time status updates reduce error rates. Supports simultaneous multi-channel processing for peak hour efficiency.
4.2.2 Inventory and Supply Chain Management: Real-time monitoring and automatic replenishment reminders. Optimizes procurement through supplier system integration. Analyzes best-sellers to improve turnover.
4.2.3 Financial and Report Analysis: Automatically generates sales, revenue, and profit reports. Data exports to ERP systems for management decision-making.
4.2.4 Customer and Membership Management: Records history and preferences. Automatically calculates points and coupons. Supports personalized and remarketing strategies.
4.2.5 Data Analysis and AI Integration: Includes trend analysis, peak hour forecasting, dish sales forecasting, and marketing evaluation.
4.3 Integrated POS System Commercial Value
Integrated POS systems are sharp tools for improving a restaurant's core competitiveness:
Order Processing Speed: Increases by 30-35% with an all-in-one system.
Inventory Management: Automates replenishment and forecasting.
Employee Efficiency: Increases by 20-25%.
4.4 Current State of POS Application in North American Asian Restaurants
According to Technomic 2023 data:
Approximately 65% of North American Asian restaurants use a POS system.
About 40% use integrated systems, and 15% use smart all-in-one systems.
High-end and chain restaurants, especially in LA, NYC, and Toronto, are more likely to adopt smart all-in-one POS.
Trend Analysis:
Small restaurants are upgrading to improve delivery and dine-in capacity.
Data-driven demand is pushing smart POS adoption.
Integration with AI marketing and self-service ordering is becoming the new standard.
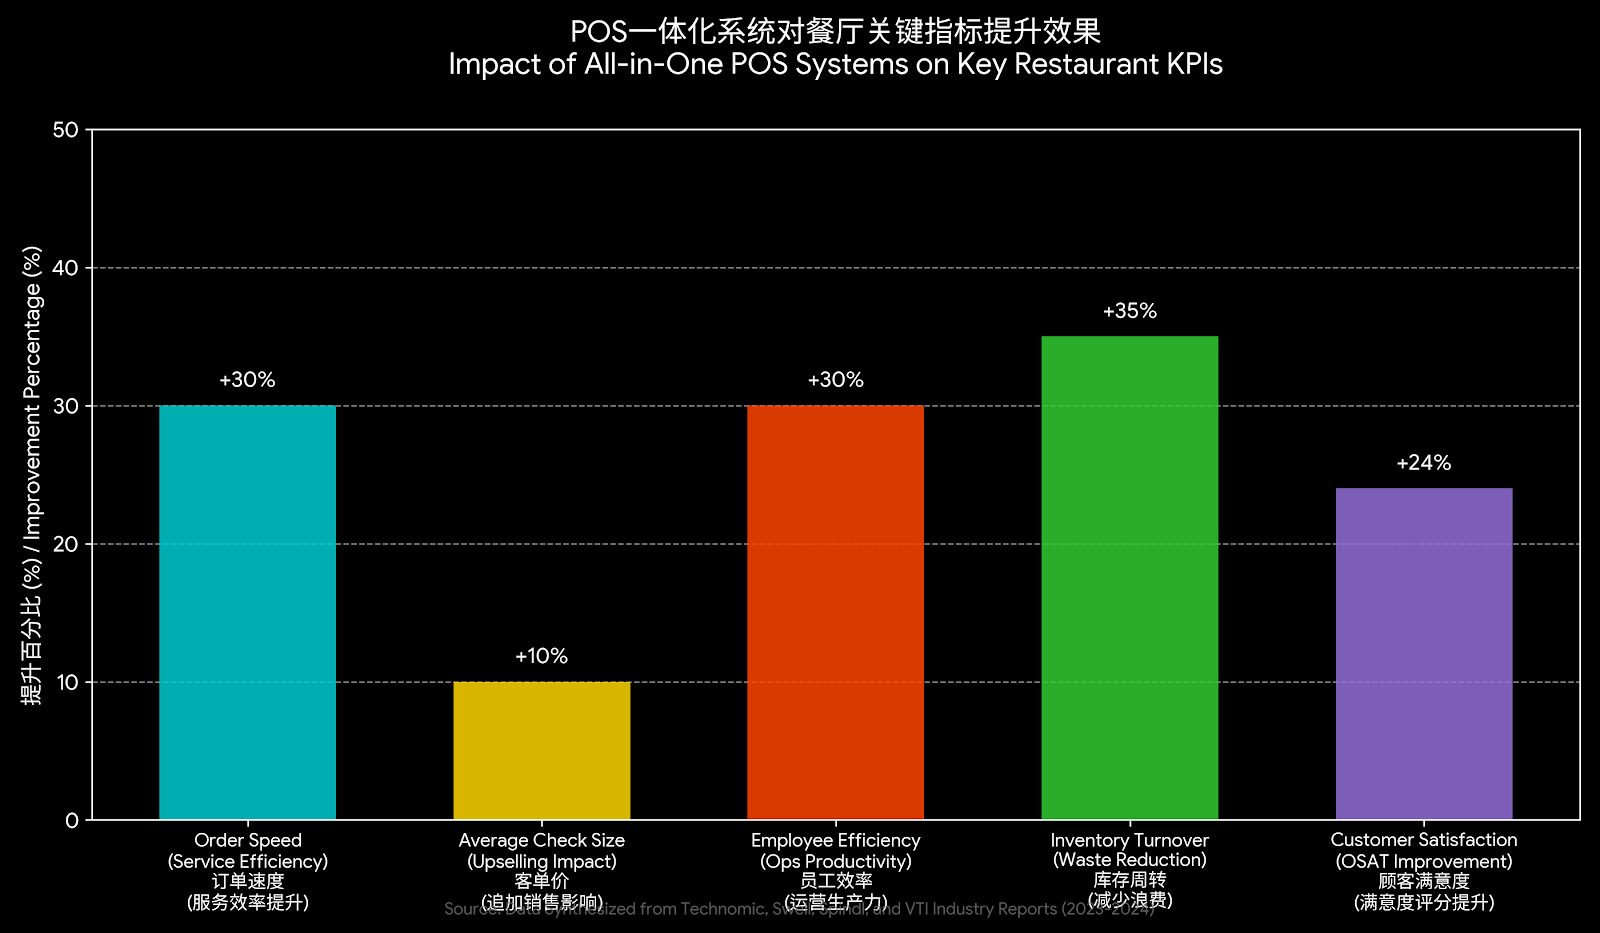
4.5 Impact of Integrated POS Systems on Key Restaurant KPIs
Order Speed: +30%.
Average Check Size: +10%.
Employee Efficiency: +30%.
Inventory Turnover: +35%.
Customer Satisfaction: +24%.
Source: Data Synthesized from Technomic Foodservice Tech Report (2024), Swell Modern POS Integration Statistics (2025), Spindl Future of Restaurant Tech, and VTI Data Insights (2023-2024).
4.6 Strategic Recommendations
Deploy smart all-in-one POS to combine dine-in, delivery, inventory, and membership management.
Integrate self-service ordering to improve peak hour handling.
Drive data-driven decisions using real-time POS data for procurement and marketing.
Combine AI marketing tools to enhance acquisition and repeat purchase rates.
Chapter 5: Self-Service Ordering and Automated Operations
5.1 Self-Service Ordering System Development Background
Restaurants face issues such as high pressure during peak hours, rising labor costs, and rising customer expectations. Self-service ordering is a critical component of digital operations, particularly for fast-casual and chain restaurants.
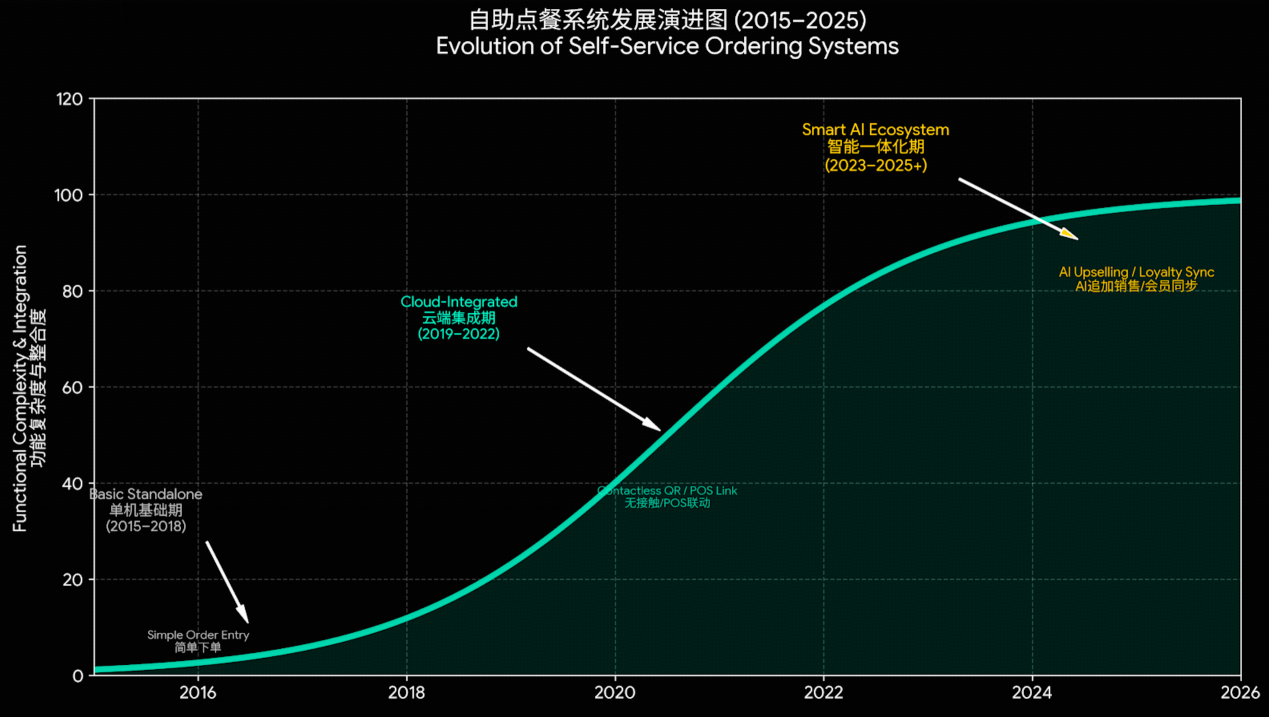
Development Stages:
Early Self-Service Kiosks: Simple functions, isolated data.
Mobile Ordering: App or WeChat ordering, often requiring manual backend processing.
Source: Data synthesized from NRA State of the Industry Reports (2015–2025), Technomic Foodservice Technology Trends, and Tillster/GRUBBRR Market Insights (2018–2026).
5.2 Self-Service Ordering System Core Functions
5.2.1 Ordering Process Optimization: Real-time inventory updates to avoid overselling. Supports set meal and personalized recommendations.
5.2.2 Diversified Payment Methods: Supports Apple/Google Pay and real-time reconciliation with POS. Automatically generates transaction reports.
5.2.3 Peak Hour Order Processing: Simultaneously handles multiple orders to reduce wait times. Interfaces with KDS to guarantee priority and efficiency.
5.2.4 Data Analysis and User Insights: Records habits and analyzes best-selling combinations. Supports marketing strategy optimization.
5.3 Commercial Value of Self-Service Ordering Systems
Ordering Speed: Improves by 50-60%.
Peak Hour Capacity: Increases by 30-40%.
Error Rate: Decreases by 70-80%.
Customer Satisfaction: Increases by 15-20%.
5.4 Current State of Self-Service Ordering in North American Asian Restaurants
Approximately 35% of North American Asian restaurants have deployed these systems. Adoption is higher in fast-casual and chain brands.
5.5 Summary of Self-Service and Automated Operation Value
Improve peak hour capacity and delivery efficiency.
Lower labor costs by reducing cashier pressure.
Optimize experience through personalized recommendations and fast payment.
Drive data-driven marketing by analyzing real-time ordering behavior.
Support multi-channel integration with dine-in, delivery, and POS.
5.6 Strategic Recommendations
Deploy systems combining POS and delivery platforms.
Integrate member and marketing functions for automated recommendations and coupons.
Optimize operations using data to adjust menu combinations.
Combine AI tools for social media content and automated ad placement.
Chapter 6: Merchant AI Marketing Tool Application
6.1 Application Background
AI marketing tools help restaurants improve brand exposure, order volume, and customer loyalty through automated ad placement, smart content generation, review analysis, and social media operation optimization.
According to Statista 2023 data:
Approximately 40% of North American restaurant enterprises have tried AI marketing tools.
AI marketing can increase average advertising ROI by 20–30%.
6.2 AI Marketing Tool Core Modules
6.2.1 Intelligent Ad Placement (AI Ads): Automatically optimizes strategies for Google, Facebook, and Instagram ads. Predicts optimal times and conducts auto A/B testing.
6.2.2 AI-Generated Social Media Content: Automatically generates content for major platforms based on dish features and preferences. Reduces manual time costs by 75%.
6.2.3 Review Insights and Sentiment Analysis: AI extracts key issues from Yelp, Google, and DoorDash reviews. Supports quick responses to negative feedback.
6.2.4 Social Media and Member Precision Marketing: Generates personalized push messages and recommendations based on history. Improves repeat purchase rates by 10-15%.
6.3 Merchant AI Marketing Tool Commercial Value
AI marketing increases ad ROI to an average of 2–2.2x and improves review analysis efficiency by 80%.
6.4 Current State of AI Marketing Application in North American Asian Restaurants
Adoption exceeds 50% in fast-casual and delivery-heavy restaurants.
6.5 Integrated Value of AI Marketing Tools
Enhance acquisition efficiency by precisely targeting potential customers.
Lower content and ad costs through automated generation and optimization.
Improve loyalty and check size via personalized activities.
Optimize satisfaction by rapidly analyzing reviews.
Realize omnichannel automation by integrating with POS and self-service systems.
6.7 Strategic Recommendations
Deploy AI tools combining ads, social media, and review analysis.
Integrate POS and self-service data for precision marketing.
Optimize strategies based on data for real-time adjustments.
Combine with systems like Chowbus for full-link automation.
Chapter 7: Technology Ecosystem Framework: North American Asian Restaurant Digital Operation Overview
7.1 Overview
A complete technical ecosystem is the core support for efficient restaurant operations, covering the full-link digital operation from acquisition to retention. This includes modules for customer acquisition, order processing, inventory, data analysis, and marketing optimization.
7.2 Technology Ecosystem Core Modules
7.2.1 Customer Acquisition: Uses AI marketing tools for behavior analysis and multi-channel advertising (Facebook, Instagram, Google Ads). Social media promotion leverages TikTok/Instagram Reels and AI content generation.
7.2.2 Order Management: Core technologies include integrated POS (dine-in, delivery, mobile), self-service systems (Kiosk/mobile for turnover), and third-party delivery platform integration.
7.2.3 Inventory and Operations Management: Features automated inventory with real-time updates and replenishment suggestions. Operational data monitoring identifies hot/slow items to support promotional activities.
7.2.4 Data Analytics: Includes sales trend analysis for peak forecasting, customer behavior analysis for precision marketing, and KPI monitoring (average check, turnover, satisfaction).
7.2.5 Marketing Optimization: Utilizes AI for automated ad copy/images and social media content across platforms. Drives repeat purchase through personalized coupons and member activity design.
7.2.6 Customer Retention: Uses membership management systems for data integration and AI-generated discount strategies. Feedback loops rapidly optimize service and menu combinations.
7.3 Summary of Technology Ecosystem Value
Operational efficiency up: Drastic improvements in speed, turnover, and delivery.
Customer experience up: Reduced wait times and personalized loyalty rewards.
Acquisition and retention up: Higher order volumes and repeat rates via AI ads.
Data-driven decisions: Real-time KPI and inventory monitoring support fine-grained operations.
7.4 Implementation Recommendations
Deploy modules step-by-step, starting with POS and ordering.
Establish a data closed-loop from acquisition to marketing.
Continuously optimize using real-time analysis.
Standardize training and processes for high system efficiency.
Chapter 8: In-Depth Case Analysis Based on POS Integration, Self-Service Ordering, and AI Marketing
Case 1: Artemis Tea Coffee (Denver) — AI Marketing Leveraging High-Multiplier ROI Growth
Background & Challenges: Faced low search visibility, high acquisition costs, and lacked direct order channels.
Digital Solution: Integrated Google Ads with branded web/app ordering through Chowbus AI, optimizing bidding and keywords.
Core Outcomes: Achieved 7.98x – 19.96x ROI with only $360.81 in ad spend. Ranked #1 on Google Maps and generated 2,819 store visits/appointments.
Insight: 2026's trend is "Marketing Automation," allowing single-store owners to achieve high returns via one-click operations.
Case 2: E-Star (Houston) — The "Full-Link Efficiency Revolution" for Mega-Buffets
Background & Challenges: Faced 15% customer loss due to checkout queues, 20% table idle rate, and high labor costs.
Digital Solution: Adopted the Chowbus POS system for visual floor plan seating (100% accuracy, 3x faster seating), zone pre-allocation (40% increase in tables served per capita), and real-time cleaning reminders.
Core Outcomes: Turnover doubled to over 3x per day, and staff turnover dropped to 5%.
Insight: Buffet competition is a "War of Efficiency"; visual data and high turnover are the only path forward for mega-restaurants.
Case 3: CHICHA San Chen — "Tea-Aware" SaaS Driving Average Check Increases
Background & Challenges: High customization (8-layer options) led to difficult training and long peak queues.
Digital Solution: Deployed a vertical POS system designed for the tea category, automating options based on professional techniques and linking to membership systems.
Core Outcomes: Average check increased by 18% through AI upselling; membership retention reached 65%. New staff training time was cut by 30%.
Insight: Category verticalization is the future of digitalization; professional systems are needed to truly empower standardized global expansion.
Chapter 9: 2026–2030 Trend Forecast: North American Asian Restaurant Digital Evolution Insights
9.1 2026–2030 Digital Development Blueprint Overview
Over the next five years, North American Asian restaurants will transition from "Tool Digitalization" to "Full Intelligence". By 2030, data-driven operations will be the baseline for survival.
9.2 AI Predictive Analysis: From "Reaction" to "Anticipation"
AI will deeply intervene in decision-making:
Smart Sales Forecasting: Reduces inventory waste by 20–25% by automatically adjusting prep based on weather, holidays, and social trends.
Dynamic Menu Optimization: Real-time analysis of profit margins and trends.
Automated Talent Scheduling: Optimizes labor ratios based on predicted peaks.
9.3 Full Popularization of Self-Service and Frictionless Payments
Penetration Forecast: Self-service penetration in Asian restaurants expected to reach 70–75% by 2030.
Payment Revolution: Mobile payments will be mainstream, with payment efficiency increasing further by 30–40%.
9.4 Role Evolution of POS Systems: Omnichannel Ecosystem Hubs
Future POS systems will be a restaurant's "brain":
Omnichannel Flow: Dine-in, delivery, livestreaming, and self-operated malls run under a unified data architecture.
Automated Cross-Store Management: Real-time sync for inventory, finance, and personnel for chains.
某跨地区管理成本降低 25% through omnichannel integration.
9.5 Strategic Insights for 2030
Digitize assets like customer behavior and dish data.
Embrace AI-native systems like the Chowbus ecosystem.
Build flexible supply chains using digital tools.
Chapter 10: Strategic Recommendations: North American Asian Restaurant Digitalization Implementation Guide
10.1 Chapter Overview
This chapter provides Strategic Recommendations and an Implementation Guide based on the preceding analysis to help managers efficiently deploy systems, improve efficiency, and enhance loyalty.
10.2 Strategic Proposals
10.2.1 Deploy Integrated POS Early: Goal is to reduce complexity and improve efficiency. Select omnichannel systems, deploy in stages (order, kitchen, inventory), train employees, and establish data loops.
10.2.2 Combine Self-Service Ordering with Delivery Platforms: Goal is to increase average check and peak hour handling. Deploy kiosks to reduce front-desk congestion and use add-on recommendations; integrate mobile ordering/payments with POS; automatically sync delivery orders with inventory.
10.2.3 Precision Acquisition Model and Automated Loyalty Paths: Goal is precision acquisition and improved repeat purchase rates. Use AI ad placement across Meta and Google, AI-generated social content, and feedback analysis to optimize service.
10.2.4 Establish Data Analysis Capabilities for Fine-Grained Operations: Goal is strategic optimization through data. Monitor KPIs (average check, turnover, OSAT) via dashboards, optimize inventory/menus based on analytics, and conduct member analysis for retention.
10.3 Practical Implementation Guide
Assess restaurant status (size, volume, staff).
Select digital tools (POS, Kiosk, AI tools).
Deploy in stages (POS/Inventory → Self-Service → AI Marketing → Data Analysis).
Establish data loops for continuous optimization.
Train employees and optimize processes.
Iterate continuously based on market trends.
10.4 Chapter Summary
Integrated POS is the core hub; self-service ordering diverts peak traffic; AI marketing drives precision acquisition; and data analysis supports strategic decisions.