Every second counts in quick service. Delays at the drive-thru, missed upsell opportunities, or inconsistent staffing can quietly drain profits across your locations. Acting on instinct might have worked before, but today, your data holds the answers.
With the right tools, quick service restaurant analytics helps you spot what’s working, fix what’s not, and make every shift more efficient. From drive-thru performance to menu pricing and customer engagement, the right insights give you control.
This post breaks down what QSR analytics is, why it matters, what to track, and how to apply it. If you’re ready to move faster, reduce waste, and grow smarter, the data you already collect is the best place to start.

Quick service restaurant analytics refers to the process of collecting and analyzing data to track performance and improve decision-making across your operations. It helps you understand what’s working, where you’re losing time or money, and how to take action.
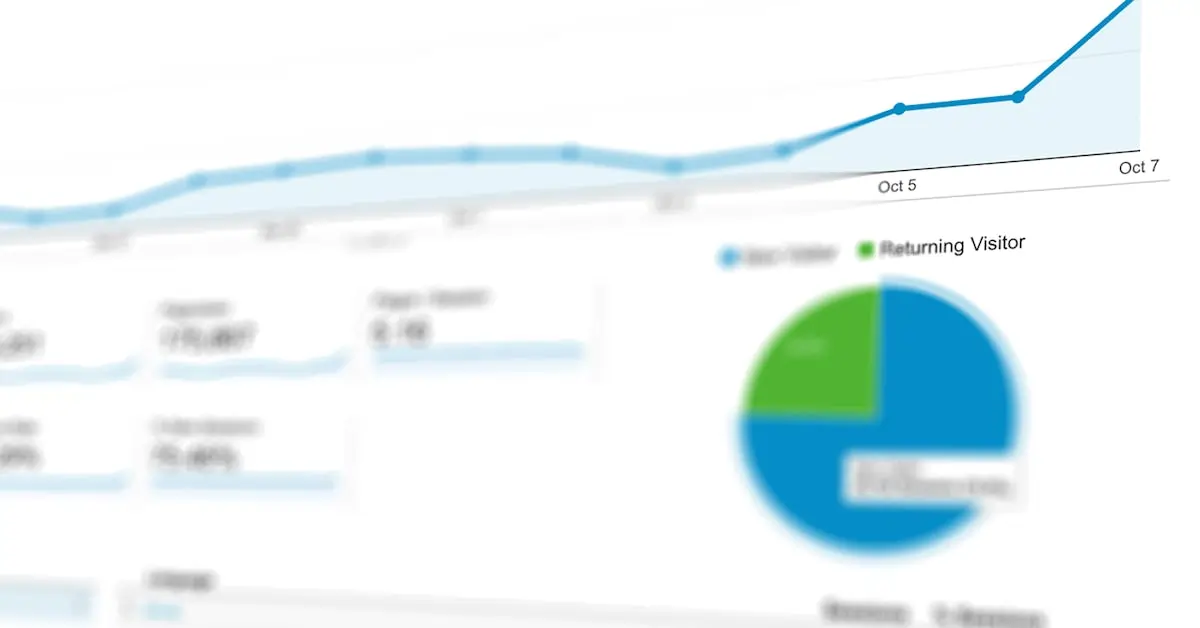
This includes data from sales, staffing, customer interactions, mobile ordering, loyalty programs, and drive-thru timing tools. When connected and analyzed properly, this data gives you visibility into trends and outcomes that impact growth and efficiency.
There are three types of analytics typically used in quick service operations:
You can apply these analytics across:
Analytics brings your data together, so decisions happen faster and with confidence.

Every decision in quick service adds up. Service times, pricing, labor, and customer experience all affect your bottom line. Relying on instinct or scattered reports slows down progress and leads to missed opportunities.
QSR analytics brings structure and speed to how you operate. You stop reacting and start optimizing.
Here’s what strong analytics can do:
QSR analytics helps you stay in control, stay efficient, and move faster in a competitive space.
KPIs make QSR analytics practical. They turn raw data into action by focusing on what drives performance. A strong analytics setup will group these indicators across three key areas: sales and financial performance, operational efficiency, and customer behavior.
These metrics track how well each location converts traffic into revenue. They also help you monitor cost control and profitability:
Average Transaction Value (ATV)
Tracks the average spend per order. Use it to gauge the effectiveness of upselling and menu pricing.
Sales per Labor Hour
Compares total sales to total labor hours worked. This metric highlights productivity and can support smarter scheduling.
Cost of Goods Sold (COGS)
Measures the cost of ingredients used for items sold. Target around 28–32% of sales, depending on your menu and pricing.
Prime Cost
Combines COGS and labor costs. Since these are your two largest expenses, tracking them closely helps maintain profitability.
Shows what percentage of revenue turns into actual profit after covering operating costs.
Use these metrics to fine-tune workflows and avoid performance bottlenecks, especially during peak hours:
Speed of Service (SoS)
Tracks how long it takes from order placement to delivery. Drive-thru and mobile orders rely heavily on this metric.
Order Accuracy
Measures the percentage of correctly fulfilled orders. High accuracy improves customer satisfaction and reduces waste.
Theoretical vs. Actual Food Cost
Compares expected food cost (based on menu recipes) to actual usage. Any variance can highlight issues with waste, over-portioning, or theft.
Customer-focused KPIs help you understand buying patterns, loyalty behavior, and promotional impact:
Customer Lifetime Value (CLV)
Estimates the total revenue a guest brings over time. CLV helps prioritize retention strategies.
Customer Acquisition Cost (CAC)
Calculates what it costs to bring in a new customer. Lowering CAC while increasing CLV leads to better ROI on marketing.
Foot Traffic and Peak Hours
Tracks how many guests visit and when. These insights support better labor planning and shift optimization.
Redemption Rates
Measures how many loyalty rewards, coupons, or offers are actually used. This shows which promotions work.
Net Promoter Score (NPS)
Gauges how likely customers are to recommend your restaurant. High scores often align with operational consistency and service quality.
Each of these KPIs connects directly to how you manage growth, streamline staffing, optimize pricing, and build long-term customer relationships. When tracked consistently, they give you a clear picture of performance across every location and shift.
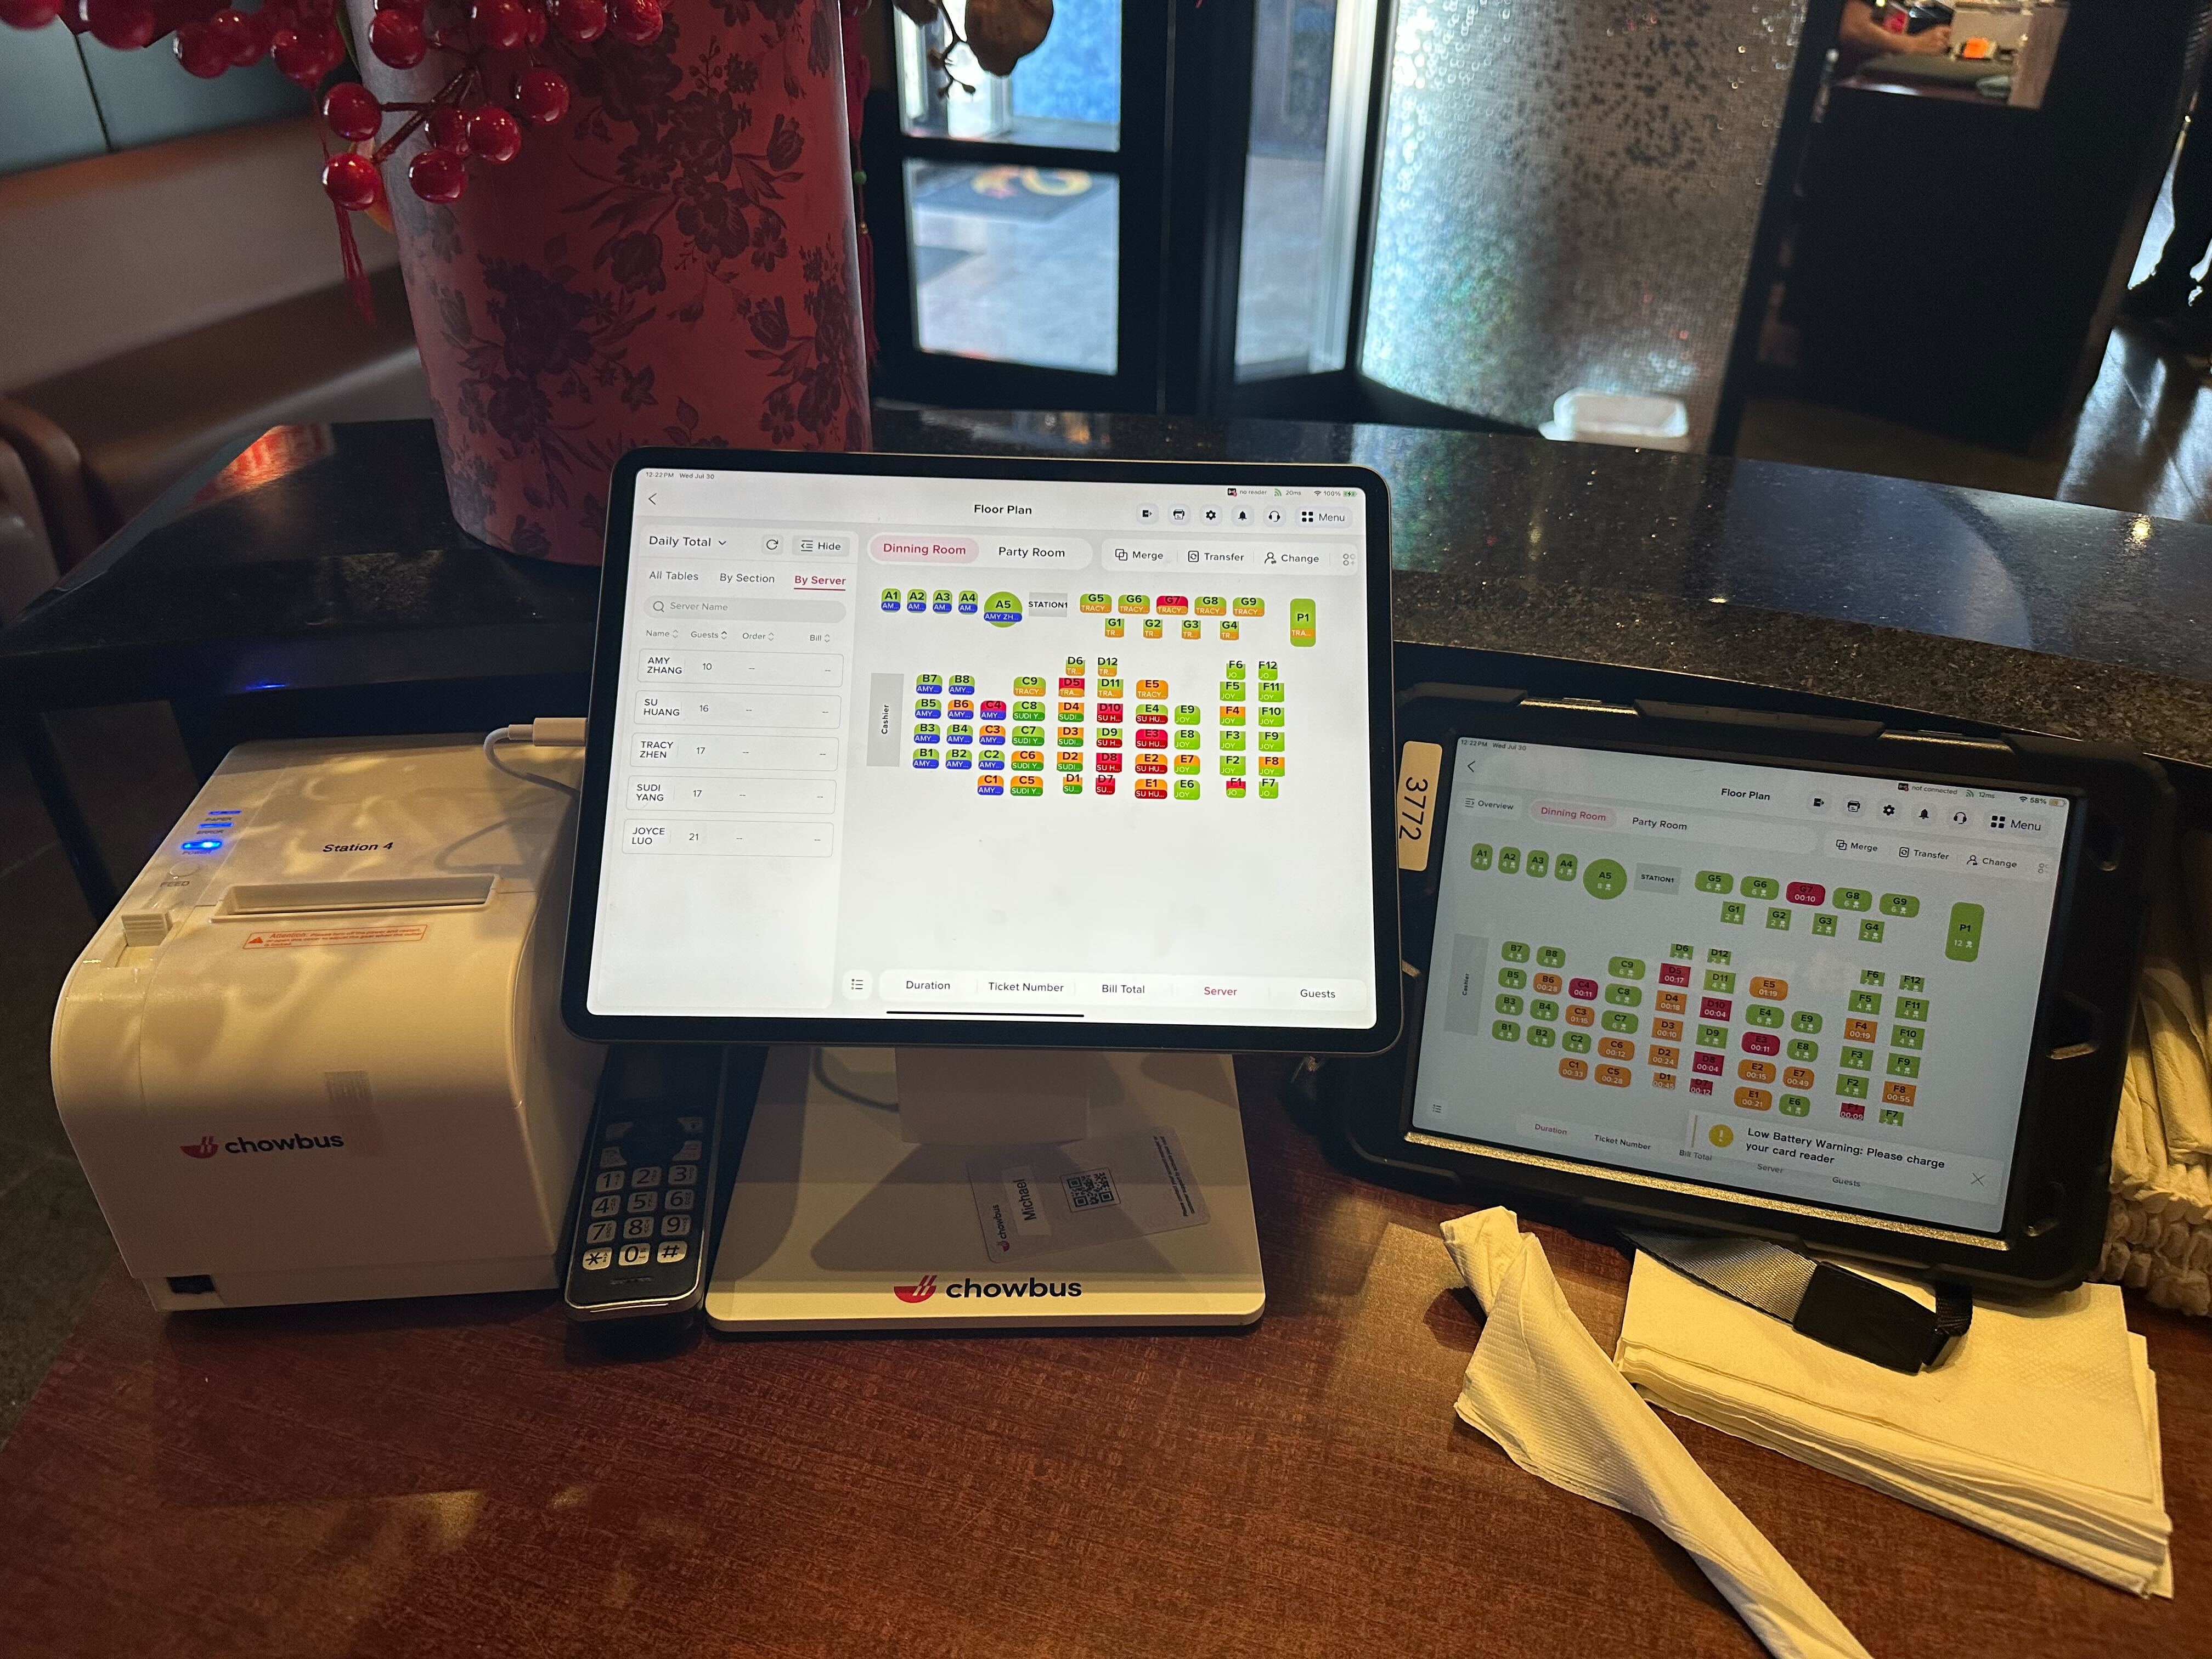
To make QSR industry data analytics actionable, your systems need to be connected. Pulling together the right data points gives you the visibility to identify trends, compare performance, and take timely action.
Here are the key sources powering effective quick-service restaurant analytics:
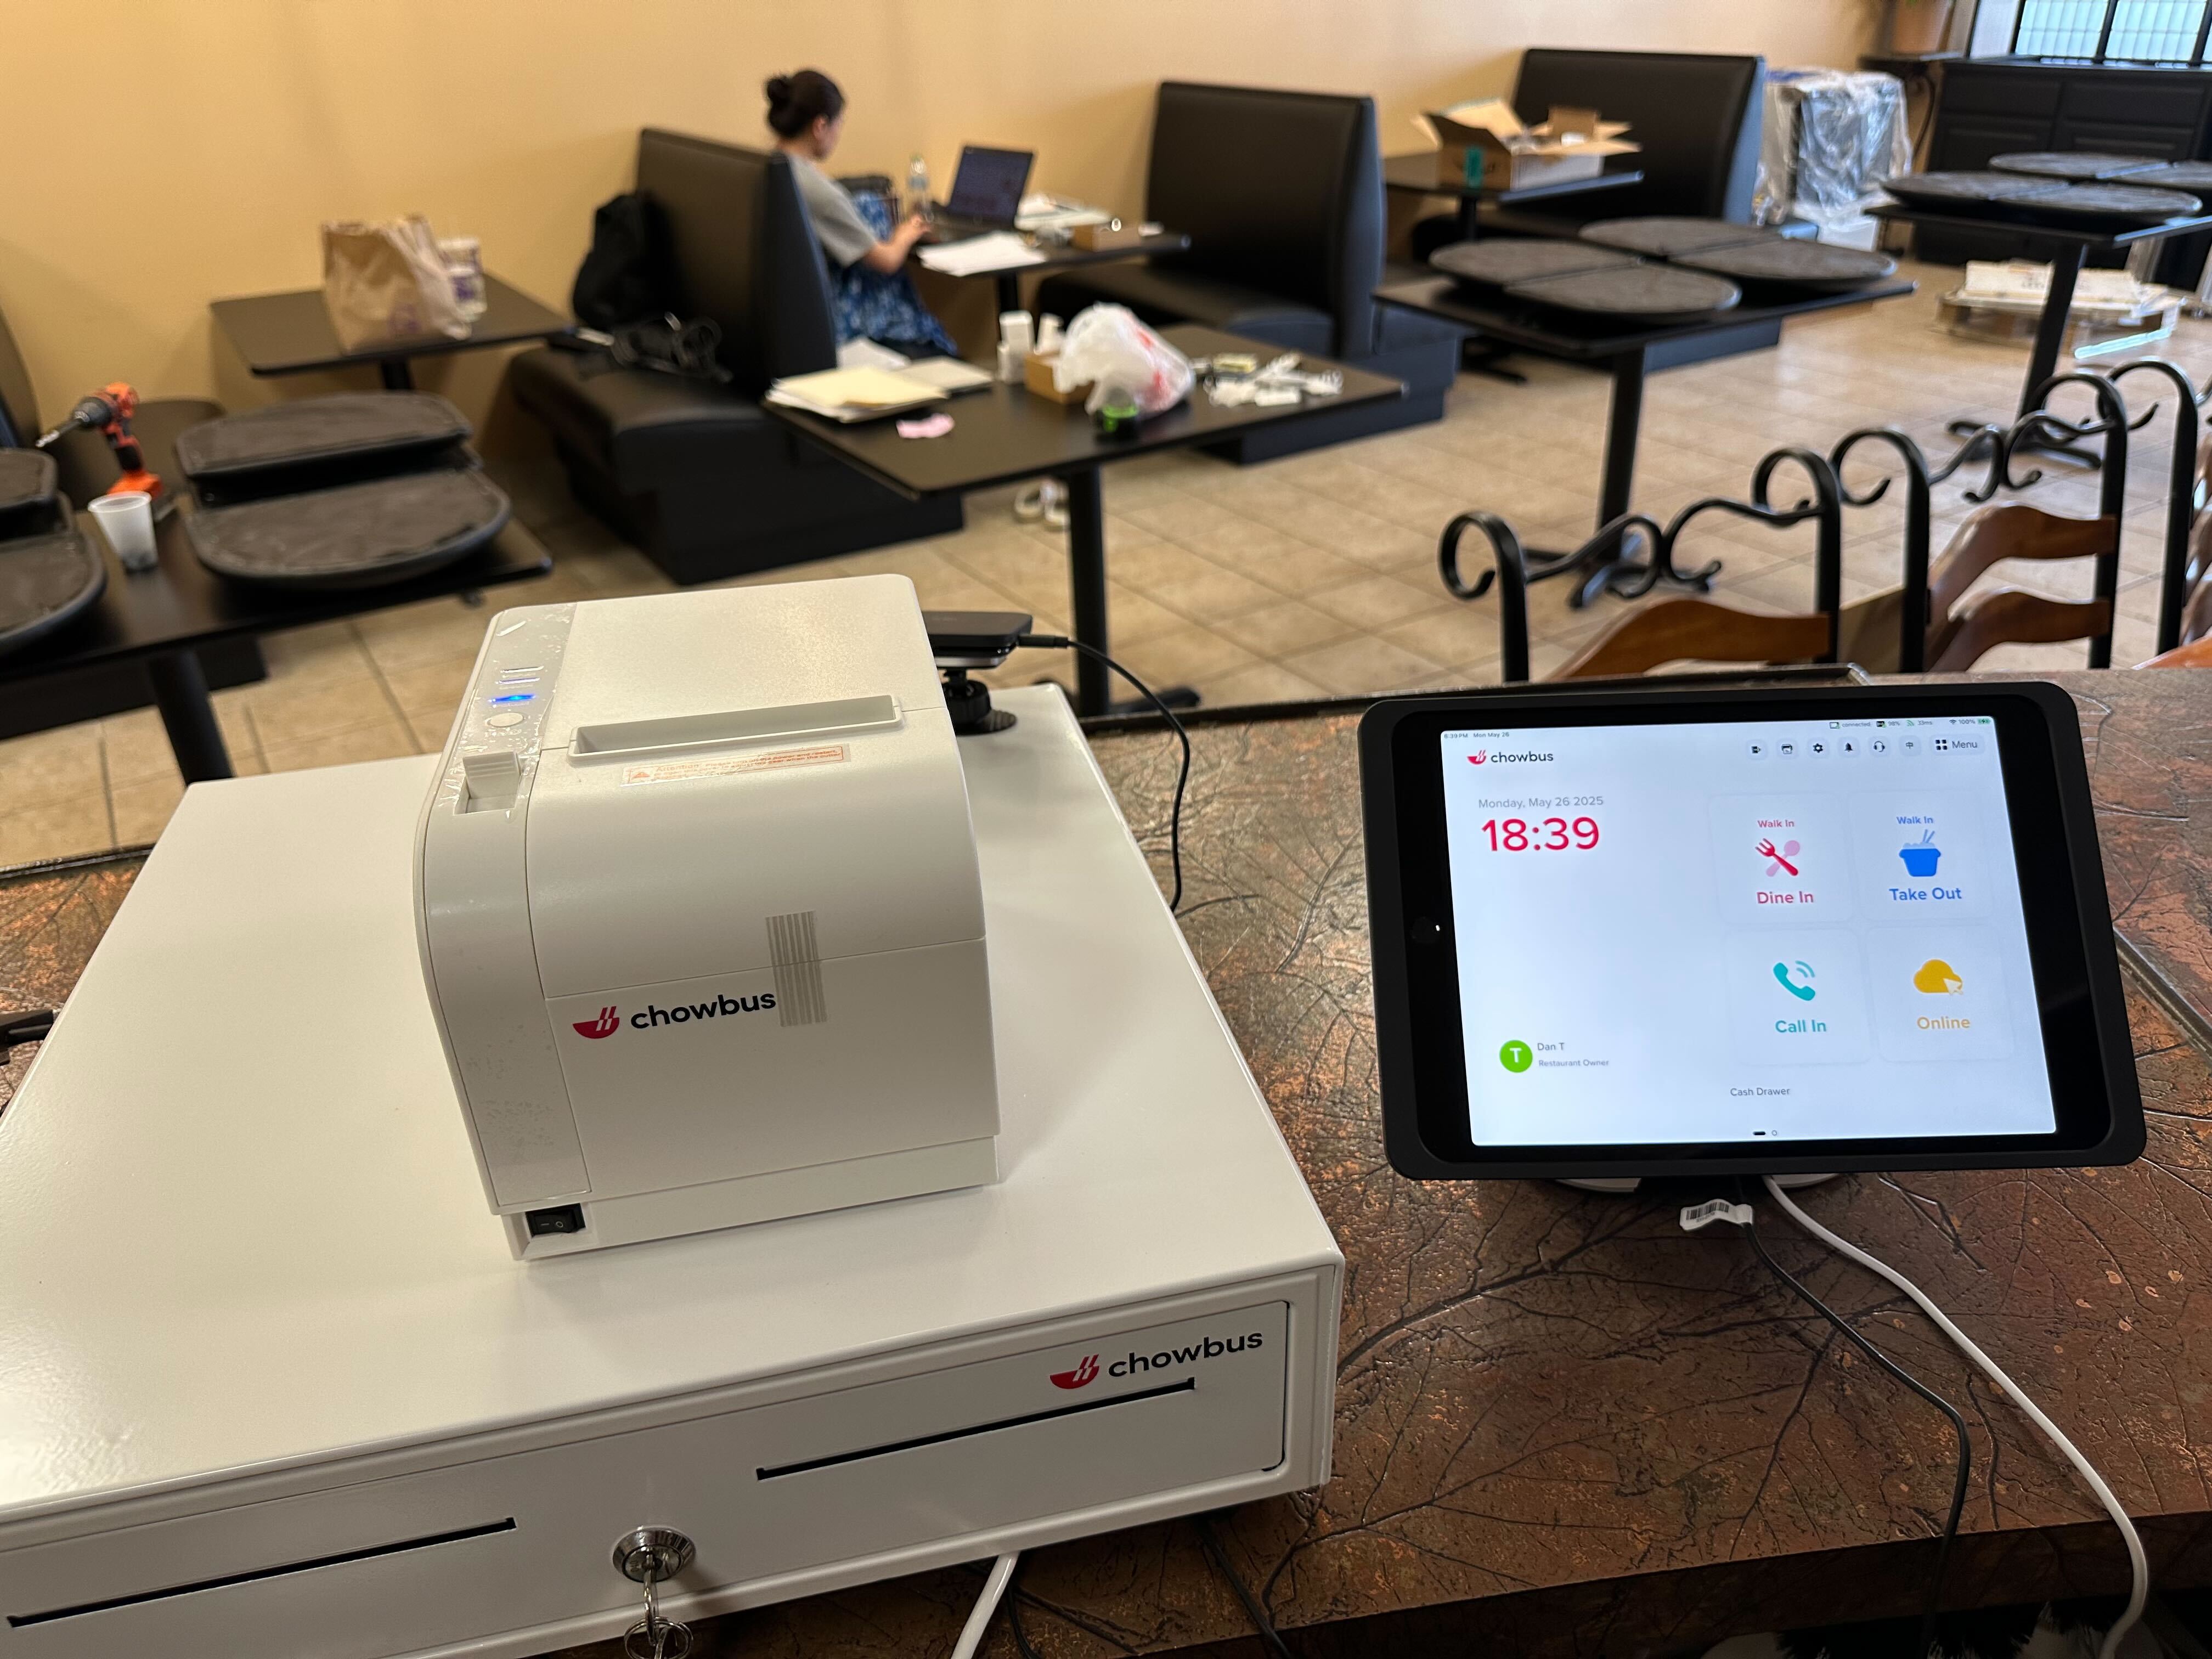
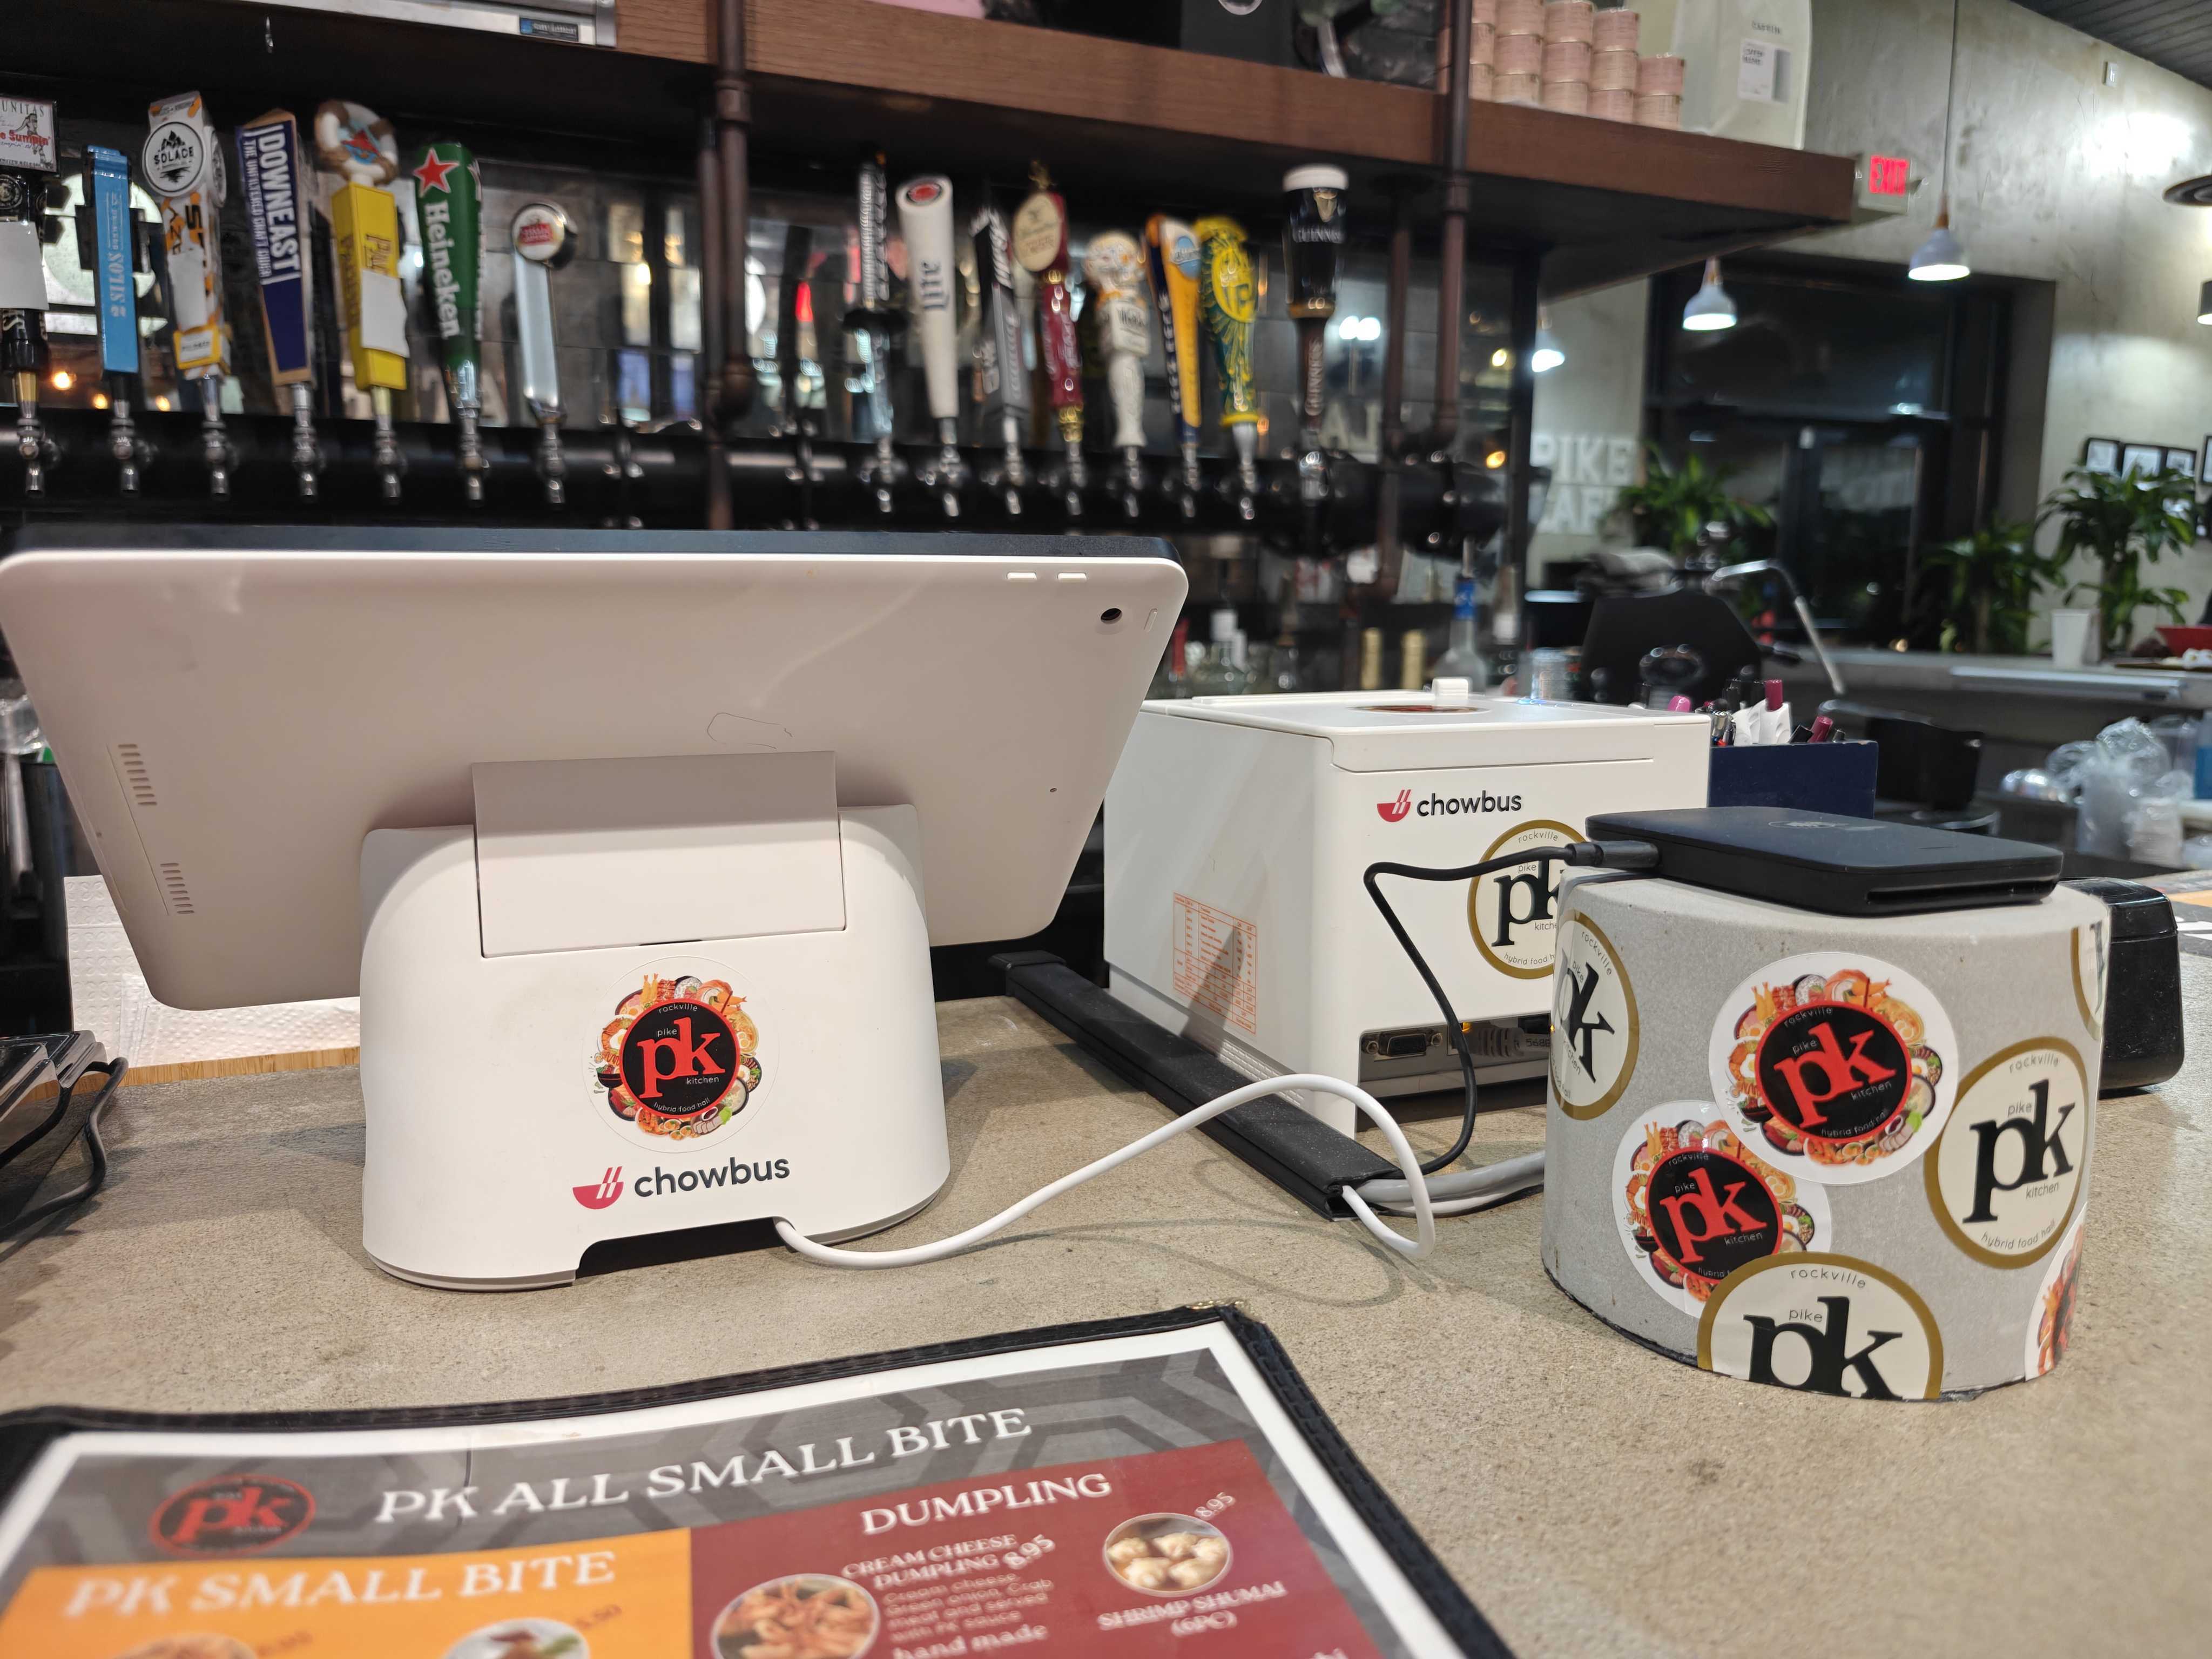
This is where most of the operational data starts. Every order, every item, every payment method — your POS captures what’s selling, when, and how. It helps you track sales patterns by location, daypart, and order type.
These tools reveal who your customers are, how often they return, what they order, and how they respond to offers. That data supports better segmentation, retention strategies, and campaign performance tracking.
Labor costs impact margins directly. Scheduling platforms help align staffing with sales trends. When you integrate labor data with sales and traffic, you can adjust staffing to improve productivity and reduce overtime.
Speed is a competitive advantage. Data from timers and sensors shows how long each vehicle waits, how quickly orders are processed, and where delays happen. That insight helps improve throughput during peak hours.
Orders from apps and third-party services offer more than revenue. They show changes in customer behavior, order preferences, and fulfillment times. Comparing in-store, pickup, and delivery trends helps refine operations and promotions.
Bringing these data streams together gives you a clear, unified view of performance. With the right tools, you can connect the dots across sales, service, labor, and customer behavior so you can act quickly and with confidence.

QSR industry data analytics helps uncover what’s working, where performance stalls, and how to improve operations with precision. Here are key areas where the right insights make a measurable difference:
Track item-level performance to see what sells, when, and how often. Use this data to highlight best-sellers, identify underperforming items, and refine your pricing strategy. Streamlining the menu based on actual sales velocity and margin contribution increases throughput and simplifies kitchen execution.
Monitor real-time data on car counts, wait times, and throughput during peak periods. Spot bottlenecks early, adjust staff placement, and test layout or workflow changes. With accurate timing and location-specific insights, you can reduce delays and increase ticket volume per hour.
Match staffing to actual demand using historical sales patterns by hour, daypart, and season. Replace overstaffed shifts and prevent underservice during high-traffic hours. Predictive scheduling helps reduce labor costs while protecting service quality.
Segment loyalty program members based on frequency, spend, and preferred order types. Use these patterns to personalize promotions and re-engagement offers. Focus efforts on customers who respond and drive repeat visits with timing and relevance that aligns with their habits.
QSR industry data analytics makes this level of decision-making possible every day. Whether you're adjusting labor in real time or reviewing last month’s performance, the same data can guide strategic initiatives and daily actions across your business.
Starting with analytics doesn't require overhauling everything at once. The goal is to connect your data to real decisions, not just collect it. Here's a clear path to getting started without stalling operations.
Define your goals
Decide what you want analytics to help you improve. Focus on targets like faster drive-thru times, more accurate labor scheduling, or increased customer retention. Keep goals measurable and tied to revenue or efficiency.
Audit your current systems.
List what platforms and tools you use today across sales, staffing, loyalty, and service speed. Identify where data lives, how it’s accessed, and where gaps exist. This helps you see what’s working and what slows you down.
Choose tools that work together.
Look for a quick service restaurant POS system or management platform that integrates your existing data sources. Avoid disconnected tools. A unified setup saves time, reduces manual reporting, and shows trends faster.
Start with a pilot group.
Test your analytics setup in a few high-volume or underperforming stores. Monitor results, gather feedback from staff, and refine the process. Use this stage to build confidence in what the data shows before rolling out system-wide.
Get buy-in early
Involve managers and operators from the start. Show them how analytics connects to their goals. Share wins quickly, even small ones. Adoption improves when people see results without having to dig for them.
Start simple. Use what you track to make one decision better. Then build on it. Analytics scales best when teams trust the process and see the value day to day.

Better service, stronger margins, and consistent performance don’t happen by chance. They start with visibility. When your decisions are backed by accurate, connected insights, you stay ahead instead of catching up. That’s the power of smart analytics. With the right approach, quick service restaurant analytics becomes part of the way you manage every day, from adjusting staffing on the fly to refining pricing or reducing customer wait times. It’s not about collecting more data. It’s about using what you already have to act faster, smarter, and with confidence.
Ready to make better decisions across all your locations?
Chowbus POS helps you connect sales, staffing, and service data in one place. With our all-in-one Quick Service Restaurant Management Software, you can reduce guesswork, automate reporting, and improve operations without the extra effort. Book a free demo with Chowbus POS today and see how the right insights support every shift.
Get clear answers to the most common questions about using analytics to drive growth, streamline operations, and boost performance. This section covers key trends, forecasts, and tools shaping the quick-service restaurant industry.
In 2025, leading QSRs are prioritizing automation, data-driven staffing, AI-powered menu personalization, and tighter performance monitoring. Chains are using quick service restaurant analytics to optimize labor, drive-thru throughput, and promotions in real time. There’s also growing demand for integrated platforms that combine POS, scheduling, and loyalty data into unified dashboards.
Several major trends are currently reshaping the Quick Service Restaurant (QSR) sector.
Digital Integration and Delivery dominate, as mobile ordering, loyalty apps, and third-party delivery partnerships become essential for revenue. Data-Driven Personalization leverages customer analytics to tailor menus, offers, and marketing, boosting loyalty.
The industry is also prioritizing Operational Efficiency, using AI and automation in kitchens to improve speed and manage labor costs. Finally, an increased focus on Sustainability and Transparency drives demand for eco-friendly packaging and clear sourcing information.
The global quick‑service restaurant (QSR) market is growing at an estimated compound annual growth rate (CAGR) of approximately 9%, according to recent forecasts.
For example, Fortune Business Insights projects a CAGR of 9.01% from 2025 to 2032. Mordor Intelligence similarly estimates an 8.38% CAGR between 2025 and 2030. Another forecast from Towards FnB (via Precedence Research) predicts a 9.02% CAGR from 2025 to 2034.
The future of QSR focuses on speed, personalization, and data-driven operations. Brands use real-time analytics to optimize staffing, reduce wait times, and tailor promotions. Mobile ordering, AI tools, and integrated POS systems are becoming standard to meet rising customer expectations and improve efficiency.
Explore our blog section for more insights and updates on quick-service restaurant analytics, POS solutions, and best practices.

DISCLAIMER: This blog post is for informational purposes only. The content does not constitute business, financial, or operational advice. Performance metrics, forecasts, and tools mentioned should be evaluated based on your specific restaurant operations and goals.
Recommended Articles: